Apinizer Worker Diagnostics Monitoring and Reporting
1-) How Does It Work?
This guide describes a simple monitoring solution that periodically collects diagnostic metrics from an Apinizer Worker pod and, at the end of the day, generates a single-file interactive HTML report from this data.
The solution consists of three parts:
- A collector shell script (
monitor.sh) — periodically reads the Worker Diagnostics API (/allendpoint) of the given environment and appends to a JSONL file with one JSON record per line. The same script can be run in parallel for multiple environments using environment name + Worker URL + Env ID arguments. - A Python report generator (
generate_report.py) — reads the JSONL file of the specified environment; normalizes memory, thread, GC, connection, and health metrics; and produces a single HTML file enriched with statistics, anomaly detection, and Chart.js-based interactive charts. - An orchestrator script (
make-report.sh) — locates the JSONL file based on the given environment name and date, checks the minimum number of records, and invokes the report generator.
The flow is as follows: Apinizer Worker (/apinizer/diagnostics/all) → monitor.sh <environment> (every 2 minutes) → <environment>-worker-diagnostics-YYYYMMDD.jsonl → make-report.sh <environment> → generate_report.py → apinizer-worker-report-<environment>-YYYYMMDD.html
2-) Prerequisites
The following requirements must be met on the machine where you will run the solution:
bash,curl,sed,wc(available in a typical Linux environment)python3(3.9 or higher; required for type hints such aslist[dict])- The report generator uses only the standard library; no
pip installis required. Chart.js, required for rendering charts, is embedded in the generated HTML file via CDN — an internet connection is sufficient while viewing the report. - Network access to the Diagnostics API of the Worker pods (e.g., via NodePort or Ingress from outside the cluster).
You will also need the ENV_ID value for each environment. This value can be copied from the details of the relevant environment under the Environments menu in the Apinizer API Manager interface and is used as the Authorization header in Diagnostics API calls.
3-) Diagnostics API
The Apinizer Worker provides the following diagnostic endpoints to query the current state of the pod:
| Endpoint | Description |
|---|---|
/jvm | Returns JVM-level memory (heap, non-heap), GC counters, and uptime information. |
/threads | Contains thread counts, thread state distribution (RUNNABLE / WAITING / TIMED_WAITING), and executor pool states. |
/threaddump | Returns instant stack traces of all threads. Intended for diagnostic purposes; not suitable for periodic collection. |
/connections | Contains Worker-specific HTTP connection pool metrics (leased, available, pending, maxTotal). |
/env | Returns runtime environment information (environment variables, system properties). |
/health | Pod health status (UP / DOWN) and sub-health checks (memory, threads, connections). |
/hazelcast | Returns cache-specific metrics (cluster members, distributed data structure states). |
/pod-version | Returns the version information of the pod. |
/all | Combines all the above metrics into a single JSON response. |
Because the report generator (generate_report.py) in this guide produces a unified report displaying memory + thread + GC + connection + health metrics per pod together, it only works with the response structure of the /all endpoint. The collector script therefore uses the /all endpoint. You can call the other endpoints directly with curl or a similar tool for raw data purposes; however, if you want to generate a report from the JSONL file collected by monitor.sh, you must use /all.
The collector script calls the following endpoint on the Worker:
GET {WORKER_URL}/apinizer/diagnostics/all?internal=true
Authorization: {ENV_ID}
The endpoint returns a large JSON containing JVM, thread, GC, connection pool, and health information for that pod. The top-level fields of the sample response are as follows:
{
  "podName": "apinizer-worker-xxxx",
  "podIp": "10.244.1.23",
  "envName": "prod",
  "version": "...",
  "responseTime": 12,
  "jvm": {
    "memory":  { "heap": { "used": 0, "max": 0 }, "nonHeap": { "used": 0 } },
    "gc":      [ { "name": "G1 Young Generation", "collectionCount": 0, "collectionTime": 0 } ],
    "uptime":  0
  },
  "threads": {
    "summary":       { "threadCount": 0, "peakThreadCount": 0, "daemonThreadCount": 0, "totalStartedThreadCount": 0 },
    "states":        { "RUNNABLE": 0, "WAITING": 0, "TIMED_WAITING": 0 },
    "executorPools": { "apinizer-async": { "poolSize": 0, "activeCount": 0, "queueSize": 0, "rejectedTaskCount": 0 },
                       "apinizer-maintenance": { "queueSize": 0, "rejectedTaskCount": 0 } }
  },
  "connections": { "pools": [ { "leased": 0, "available": 0, "pending": 0, "maxTotal": 0 } ] },
  "health":      { "status": "UP",
                   "checks": { "memory": { "status": "UP" },
                               "threads": { "deadlocks": 0 },
                               "connections": { "activeConnections": 0 } } }
}
When the ENV_ID value is entered incorrectly, the Worker returns 401 Unauthorized. The collector script detects this situation and writes the relevant line to the file as an error record; however, subsequent samples will also continue to fail. It is recommended to check the first output as soon as you start the script.
4-) Setting Up the Collector Script
A single monitor.sh file takes the information about which environment to monitor as an argument. This way, there is no need for separate script files to monitor different environments (e.g., dev, prod, staging); the same script file can be run in multiple terminals with different arguments to perform parallel monitoring.
You can access ready-to-use copies of the three scripts described in this guide (monitor.sh, generate_report.py, make-report.sh) from the following link:
It is sufficient to download the files to the same directory and make them executable with the command chmod +x monitor.sh make-report.sh.
monitor.sh — Dynamic Collector Script
Save the following script with the name monitor.sh. During use, pass the environment name, Worker URL, and Env ID values as arguments on the command line.
#!/usr/bin/env bash
# Apinizer Worker — Dynamic environment monitor
# Reads the /all endpoint of the Diagnostics API every 2 minutes and writes to a JSONL file.
#
# Usage:
#   1) With arguments:
#        ./monitor.sh <ENV_NAME> <WORKER_URL> <ENV_ID> [INTERVAL_SEC]
#        ./monitor.sh dev  http://worker-dev.company.local:8091  69db6b2268bd1a7a04552ad6
#        ./monitor.sh prod http://worker-prod.company.local:8091 63ca7ed05c8e155862d99e88 60
#
#   2) By filling in the defaults below and running without arguments:
#        ./monitor.sh
#
# Output: <ENV_NAME>-worker-diagnostics-YYYYMMDD.jsonl

# ── Default Configuration (used if no arguments are provided) ────────────────
DEFAULT_ENV_NAME=""                              # E.g.: dev | prod | staging
DEFAULT_WORKER_URL=""                            # E.g.: http://worker.company.local:8091
DEFAULT_ENV_ID=""                                # API Manager → Environments → <env> → ID
DEFAULT_INTERVAL=120

ENDPOINT="all"                                   # /all — endpoint combining all metrics

# ── Argument Processing ──────────────────────────────────────────────────────
ENV_NAME="${1:-$DEFAULT_ENV_NAME}"
WORKER_URL="${2:-$DEFAULT_WORKER_URL}"
ENV_ID="${3:-$DEFAULT_ENV_ID}"
INTERVAL="${4:-$DEFAULT_INTERVAL}"

# ── Code (do not modify) ─────────────────────────────────────────────────────
set -uo pipefail

usage() {
    cat <<EOF
Usage: $0 <ENV_NAME> <WORKER_URL> <ENV_ID> [INTERVAL_SEC]

Example:
    $0 dev  http://worker-dev.company.local:8091  69db6b2268bd1a7a04552ad6
    $0 prod http://worker-prod.company.local:8091 63ca7ed05c8e155862d99e88 60

Note: If you fill in the DEFAULT_* values at the beginning of the script,
      you can also run it without arguments.
EOF
    exit 1
}

if [[ -z "$ENV_NAME" || -z "$WORKER_URL" || -z "$ENV_ID" ]]; then
    echo "ERROR: ENV_NAME, WORKER_URL, and ENV_ID are required."
    echo
    usage
fi

# Ensure environment name is file-safe (no spaces, slashes, etc. allowed)
if [[ ! "$ENV_NAME" =~ ^[A-Za-z0-9._-]+$ ]]; then
    echo "ERROR: ENV_NAME can only contain letters, digits, '.', '_', '-'."
    exit 1
fi

OUTPUT_FILE="${ENV_NAME}-worker-diagnostics-$(date +%Y%m%d).jsonl"
TMP_BODY="/tmp/_wdiag_${ENV_NAME}_body.tmp"

collect() {
    local ts
    ts=$(date -u +"%Y-%m-%dT%H:%M:%SZ")

    local response http_code body
    response=$(curl -s --max-time 30 \
        -o "$TMP_BODY" \
        -w "%{http_code}" \
        -H "Authorization: ${ENV_ID}" \
        "${WORKER_URL}/apinizer/diagnostics/${ENDPOINT}?internal=true" 2>/dev/null)
    http_code="$response"
    body=$(cat "$TMP_BODY" 2>/dev/null)

    if [[ -z "$body" ]]; then
        echo "{\"collectedAt\":\"${ts}\",\"error\":\"connection error\"}" >> "$OUTPUT_FILE"
        echo "  ERROR: Could not reach Worker (${WORKER_URL})"
        return 1
    fi

    if [[ "$http_code" == "401" ]]; then
        echo "{\"collectedAt\":\"${ts}\",\"error\":\"unauthorized - invalid ENV_ID\"}" >> "$OUTPUT_FILE"
        echo "  ERROR: 401 Unauthorized — check the ENV_ID value."
        return 1
    fi

    local line
    line=$(echo "$body" | sed "s/^{/{\"collectedAt\":\"${ts}\",/")
    echo "$line" >> "$OUTPUT_FILE"
}

echo "[${ENV_NAME}] Worker Diagnostics monitoring started"
echo "  Environment : $ENV_NAME"
echo "  Worker      : $WORKER_URL"
echo "  Endpoint    : /$ENDPOINT"
echo "  Interval    : ${INTERVAL}s"
echo "  Output      : $OUTPUT_FILE"
echo "  Press Ctrl+C to stop"
echo "──────────────────────────────────────────"

while true; do
    printf "[%s] Reading... " "$(date '+%H:%M:%S')"
    if collect; then
        echo "OK → $OUTPUT_FILE"
    fi
    sleep "$INTERVAL"
done
Making the Script Executable and Starting It
chmod +x monitor.sh

# For a single environment:
./monitor.sh prod http://worker-prod.company.local:8091 63ca7ed05c8e155862d99e88

# To monitor multiple environments in parallel — in different terminals (or tmux panes):
./monitor.sh dev  http://worker-dev.company.local:8091  69db6b2268bd1a7a04552ad6
./monitor.sh prod http://worker-prod.company.local:8091 63ca7ed05c8e155862d99e88
Each run produces its own JSONL file using the environment name in the argument (dev-worker-diagnostics-20260422.jsonl, prod-worker-diagnostics-20260422.jsonl, etc.); files do not mix with each other.
The script samples every 120 seconds by default. For more or less frequent sampling, you can pass a value in seconds as the fourth argument (e.g., ./monitor.sh prod <url> <id> 60). Going below 60 seconds may cause unnecessary load on the Worker; above 300 seconds may miss short-term spikes.
Continuous Background Execution
Since the monitoring scripts run with a while true loop, they stop when the terminal session is closed. To keep them running continuously, one of the following methods can be preferred depending on your use case:
tmuxorscreenfor test/development environments — If you start the script in a separate tmux session, it will continue to run even if you close your SSH connection. You can later reconnect to the session and watch the output live. It is a fast and simple solution; however, the script does not automatically come up when the server is restarted.systemdservice for production environments — The standard method for managing background services on Linux. A.serviceunit file is written for each environment; arguments such asExecStart=/path/to/monitor.sh prod <url> <id>are provided as the command line. This way, the service starts automatically when the server restarts, retries automatically if it exits unexpectedly (Restart=always), and its output goes to system logs (journalctl). For production use, this is the preferred method in terms of continuity and observability.
If a container-based approach is preferred, the collector script can be placed in a small Docker image that takes environment information as environment variables and run on Kubernetes as a persistent Deployment or a scheduled CronJob.
5-) JSONL Output Format
At each sampling, the collector injects the collectedAt field at the very beginning of the JSON response returned from the Worker and appends it to the output file as a single line. This format is known as JSONL (JSON Lines) — each line is an independent and valid JSON object.
{"collectedAt":"2026-04-22T09:02:00Z","podName":"apinizer-worker-xxxx","podIp":"...","envName":"prod","version":"...","responseTime":12,"jvm":{...},"threads":{...},"connections":{...},"health":{...}}
If a sampling fails, the line only contains an error record; the report generator automatically skips these lines when reading:
{"collectedAt":"2026-04-22T09:04:00Z","error":"connection error"}
File name pattern: <ENV_NAME>-worker-diagnostics-YYYYMMDD.jsonl
For example:
dev-worker-diagnostics-20260422.jsonlprod-worker-diagnostics-20260422.jsonlstaging-worker-diagnostics-20260422.jsonl
The date suffix in the file name is calculated when each sampling line is written, not when the script is started. In practice, if the collector is running at local midnight, records will start flowing into the next day's file. For daily reports, it is appropriate to restart the collectors at the beginning of the day (e.g., 00:05) or to run the report generation on the previous day's files.
6-) Report Generator
The report generator reads the JSONL file of the specified environment and outputs a single HTML file. The output file is self-contained; it does not require any other assets, can be sent as an email attachment, or opened from a shared disk.
generate_report.py — Report Generator Script
Save the generate_report.py file to the directory where the collector script produces output (next to the JSONL files). The script is written entirely with the Python standard library and requires no additional dependencies. The full source code is included in the appendix at the end of the document; the main functions and operating logic are summarized below.
The script works in four main stages:
def load_jsonl(path: str) -> list[dict]:
    """Reads the JSONL file, skipping missing/invalid lines."""
    # ...

def extract_metrics(record: dict) -> dict | None:
    """Returns a normalized metric dict from the raw diagnostic record."""
    # heap, nonHeap, gc, threads, executorPools, connections, health...

def env_stats(records: list[dict]) -> dict:
    """Computes statistics of all metrics for an environment."""
    # min / max / avg / median / p95 / stddev — both total and per pod

def detect_anomalies(records: list[dict]) -> list[dict]:
    """Performs threshold-based anomaly detection."""
    # ...
The default threshold values used for anomaly detection are as follows. You can adjust the THRESHOLDS dictionary according to your own SLAs.
THRESHOLDS = {
    "heapPct":        {"warn": 50,  "crit": 75,   "label": "Heap Usage %"},
    "responseTime":   {"warn": 50,  "crit": 200,  "label": "Diagnostic Response ms"},
    "connLeased":     {"warn": 500, "crit": 2000, "label": "Active HTTP Connections"},
    "asyncQueueSize": {"warn": 10,  "crit": 50,   "label": "Async Pool Queue"},
    "maintQueueSize": {"warn": 10,  "crit": 50,   "label": "Maintenance Queue"},
    "gcOldCount":     {"warn": 1,   "crit": 5,    "label": "GC Old Count"},
    "deadlocks":      {"warn": 1,   "crit": 1,    "label": "Deadlock"},
    "asyncRejected":  {"warn": 1,   "crit": 10,   "label": "Async Rejected Tasks"},
}
make-report.sh — Orchestrator Script
The following script finds the JSONL file based on the given environment name and date and invokes the report generator. Save it as make-report.sh in the same directory as generate_report.py.
#!/usr/bin/env bash
# Generates an HTML report using today's JSONL file of the specified environment.
#
# Usage:
#   ./make-report.sh <ENV_NAME> [DATE_YYYYMMDD]
#
# Example:
#   ./make-report.sh dev
#   ./make-report.sh prod 20260421

set -e

if [ -z "${1:-}" ]; then
    echo "Usage: $0 <ENV_NAME> [DATE_YYYYMMDD]"
    echo "Example : $0 dev"
    echo "Example : $0 prod 20260421"
    exit 1
fi

ENV_NAME="$1"
DATE="${2:-$(date +%Y%m%d)}"

JSONL_FILE="${ENV_NAME}-worker-diagnostics-${DATE}.jsonl"

if [ ! -f "$JSONL_FILE" ]; then
    echo "ERROR: $JSONL_FILE does not exist. Is monitor.sh $ENV_NAME ... running?"
    exit 1
fi

count=$(wc -l < "$JSONL_FILE")
echo "[$ENV_NAME] record count: $count"

if [ "$count" -lt 3 ]; then
    echo "WARNING: At least 3 records are needed for meaningful charts. Wait a bit longer."
fi

python3 generate_report.py --env "$ENV_NAME" --date "$DATE"
To run:
chmod +x make-report.sh

# Today's report:
./make-report.sh prod

# Report for a previous day:
./make-report.sh prod 20260421
CLI Usage
generate_report.py can also be run directly. Supported options:
# Generate report from today's file (required argument: --env)
python3 generate_report.py --env prod

# Use the file for a specific date
python3 generate_report.py --env prod --date 20260421

# Manually specify the file and output
python3 generate_report.py \
    --env prod \
    --input prod-worker-diagnostics-20260421.jsonl \
    --out report.html
The output file is written by default with the name apinizer-worker-report-<ENV>-YYYYMMDD.html to the same directory as the JSONL file.
7-) Report Content
The generated HTML file is a single-page interactive dashboard. The environment label, report summary, and anomaly badges are at the top; the content is divided into six tabs.
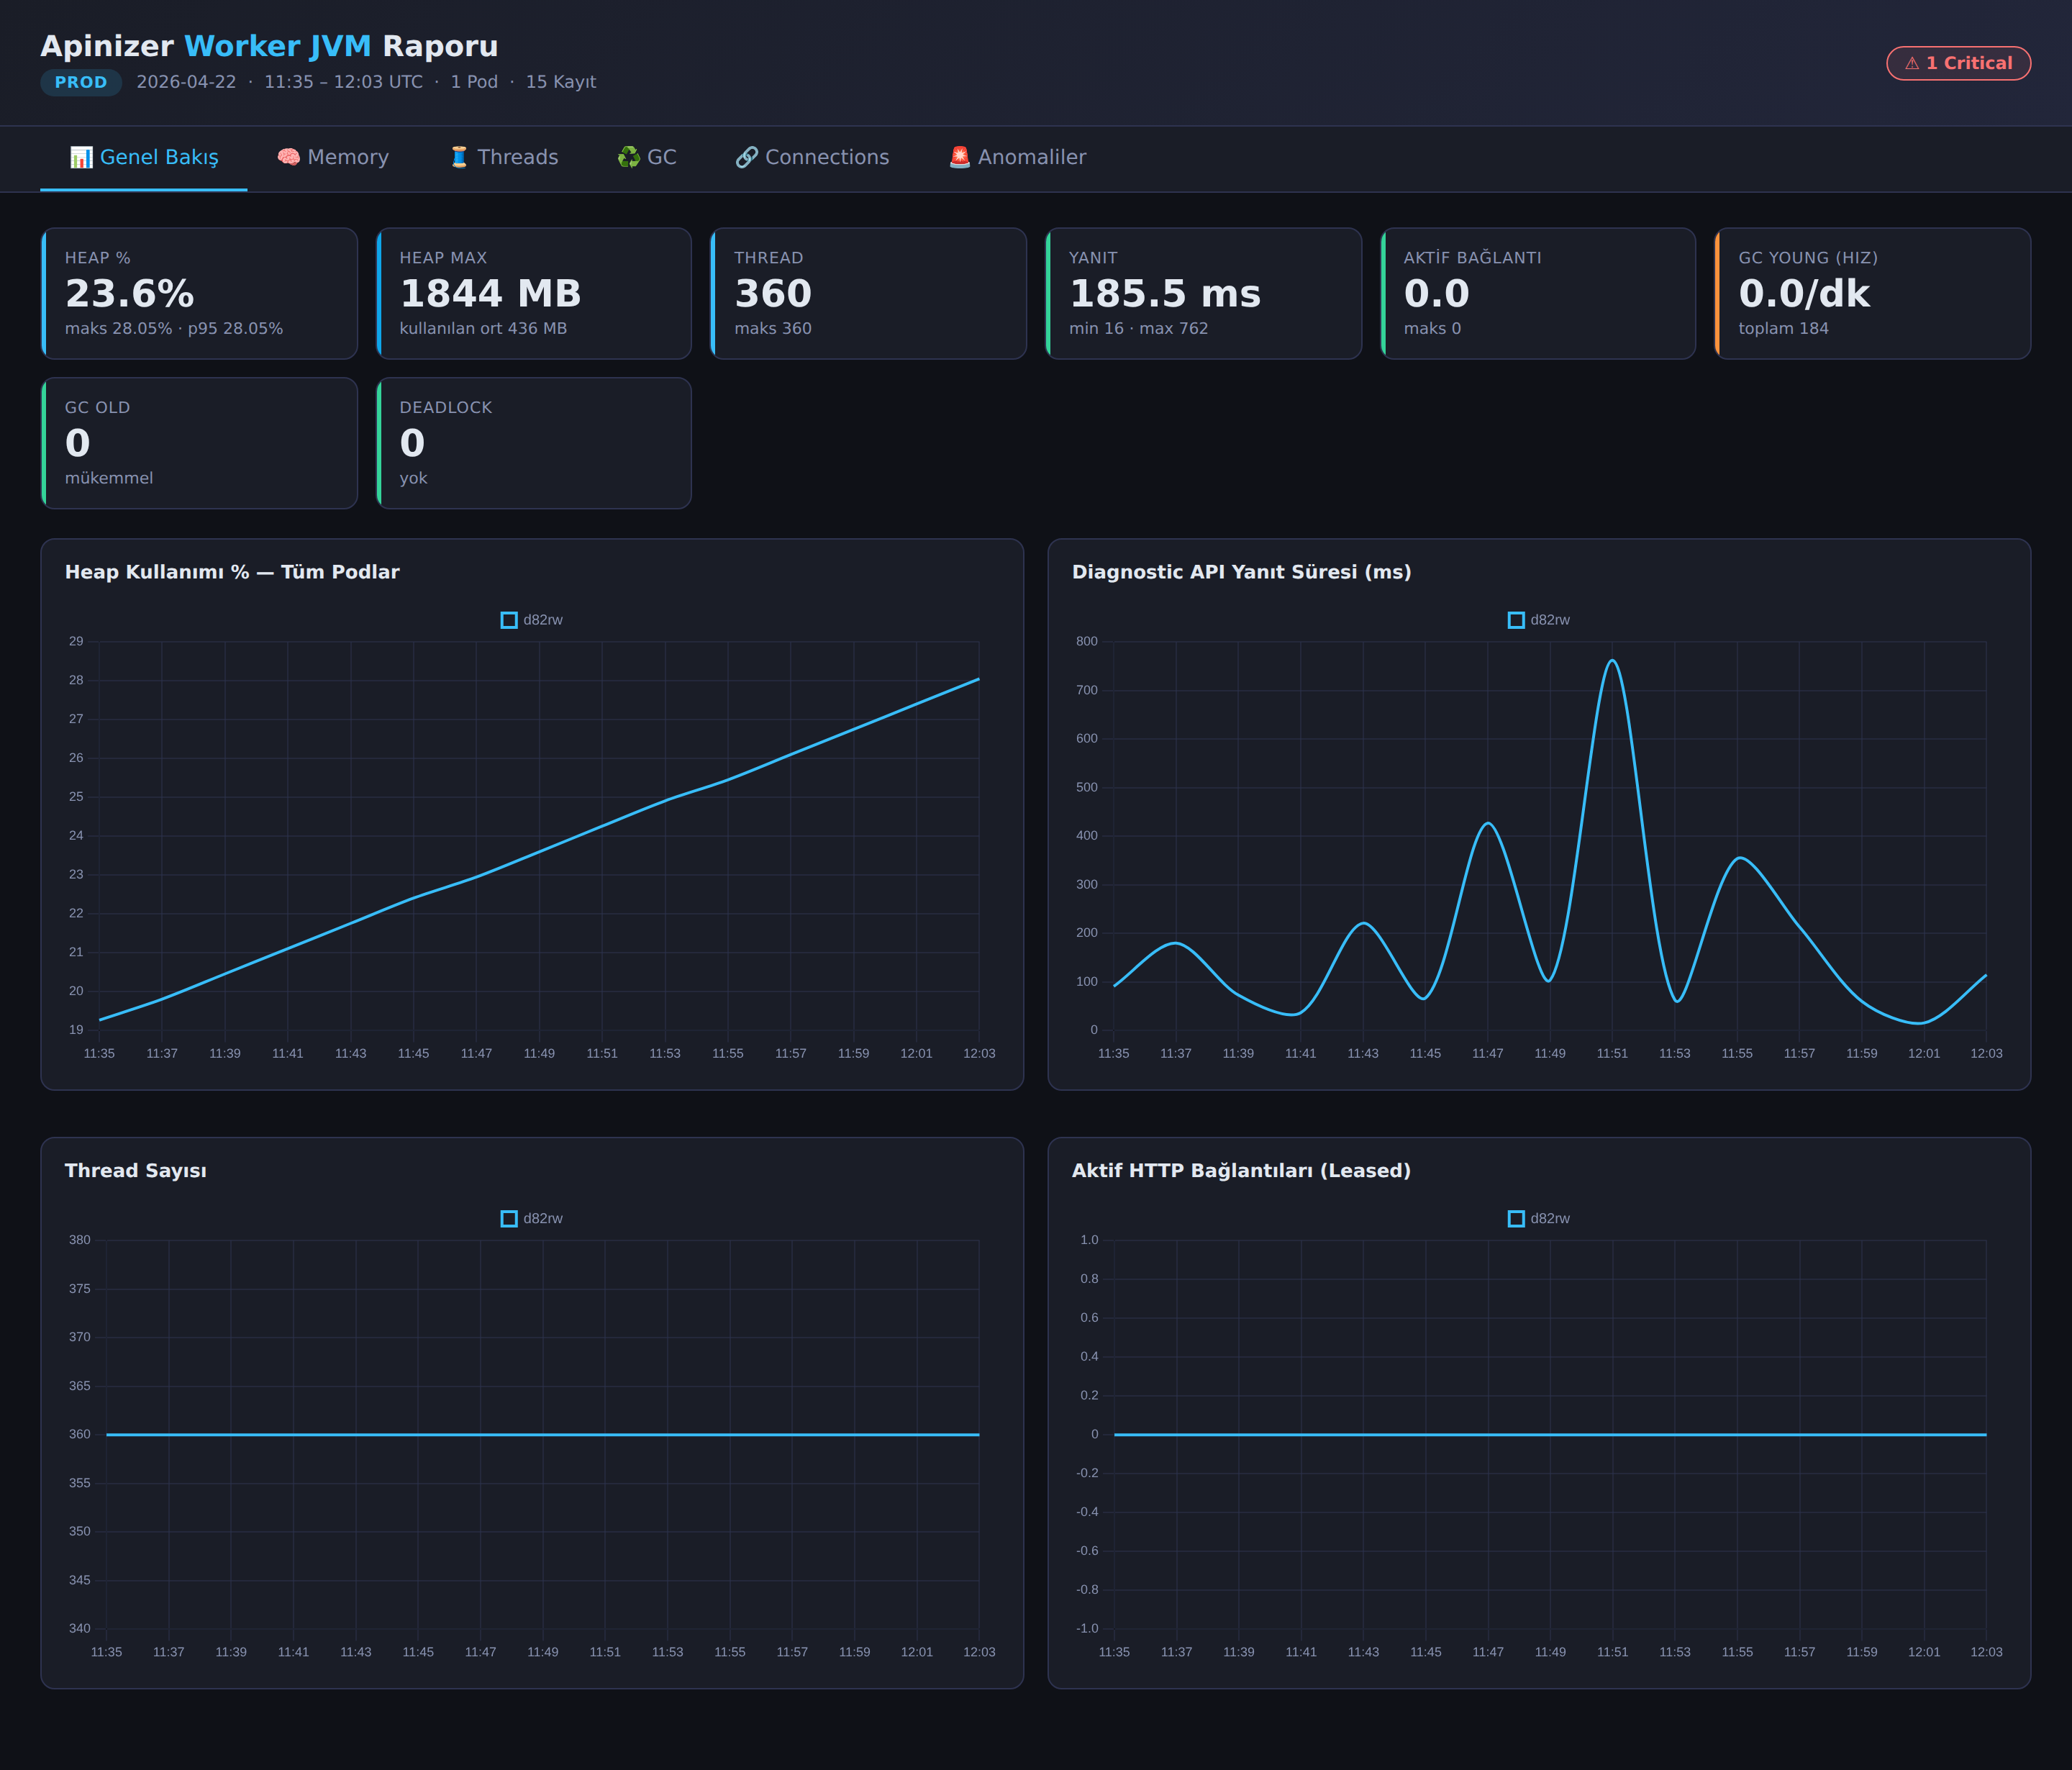
Tabs
- Overview — Summary cards of key metrics such as Heap %, Heap Max, thread count, response time, active connections, GC Young rate, GC Old, and deadlocks; below, time series charts comparing all pods on the same chart (Heap %, response time, thread count, active connections). It is the tab selected when the page opens.
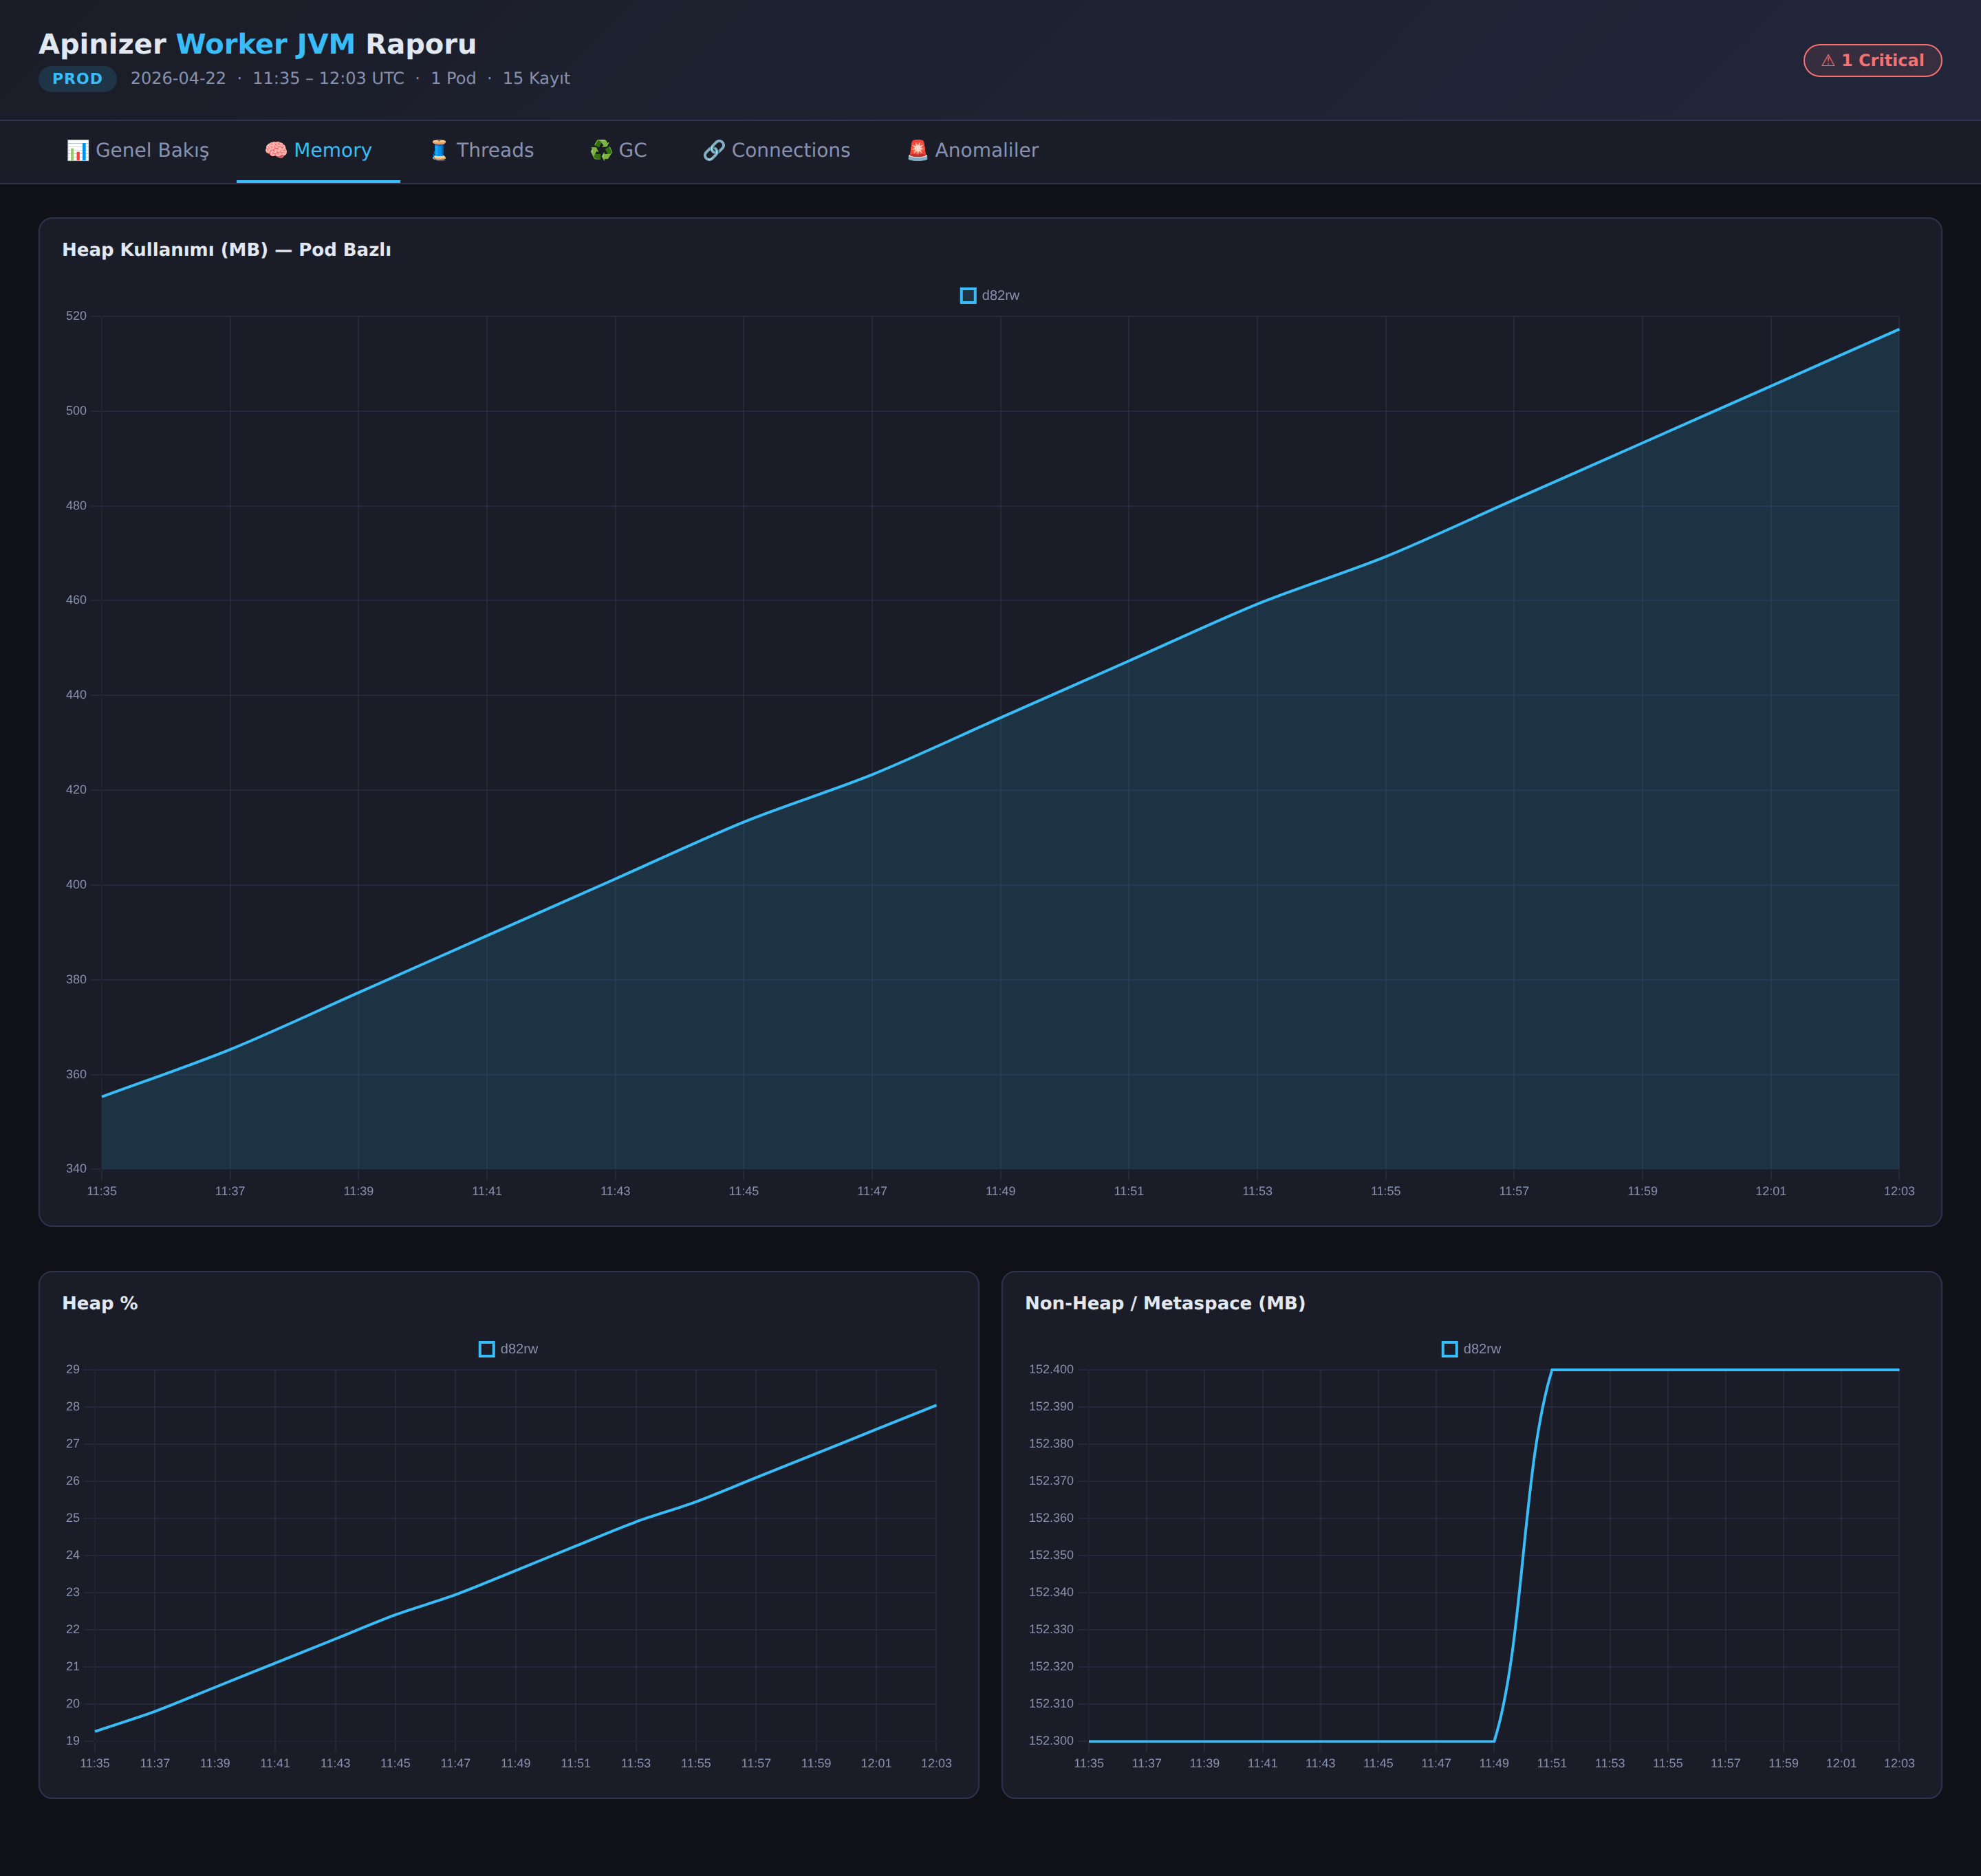
- Memory — Heap usage (MB and %) and non-heap / metaspace charts. Ideal for seeing how heap usage changes over time; in a stable environment, the heap forms a sawtooth pattern, while a pod experiencing a memory leak shows a constantly upward trend.
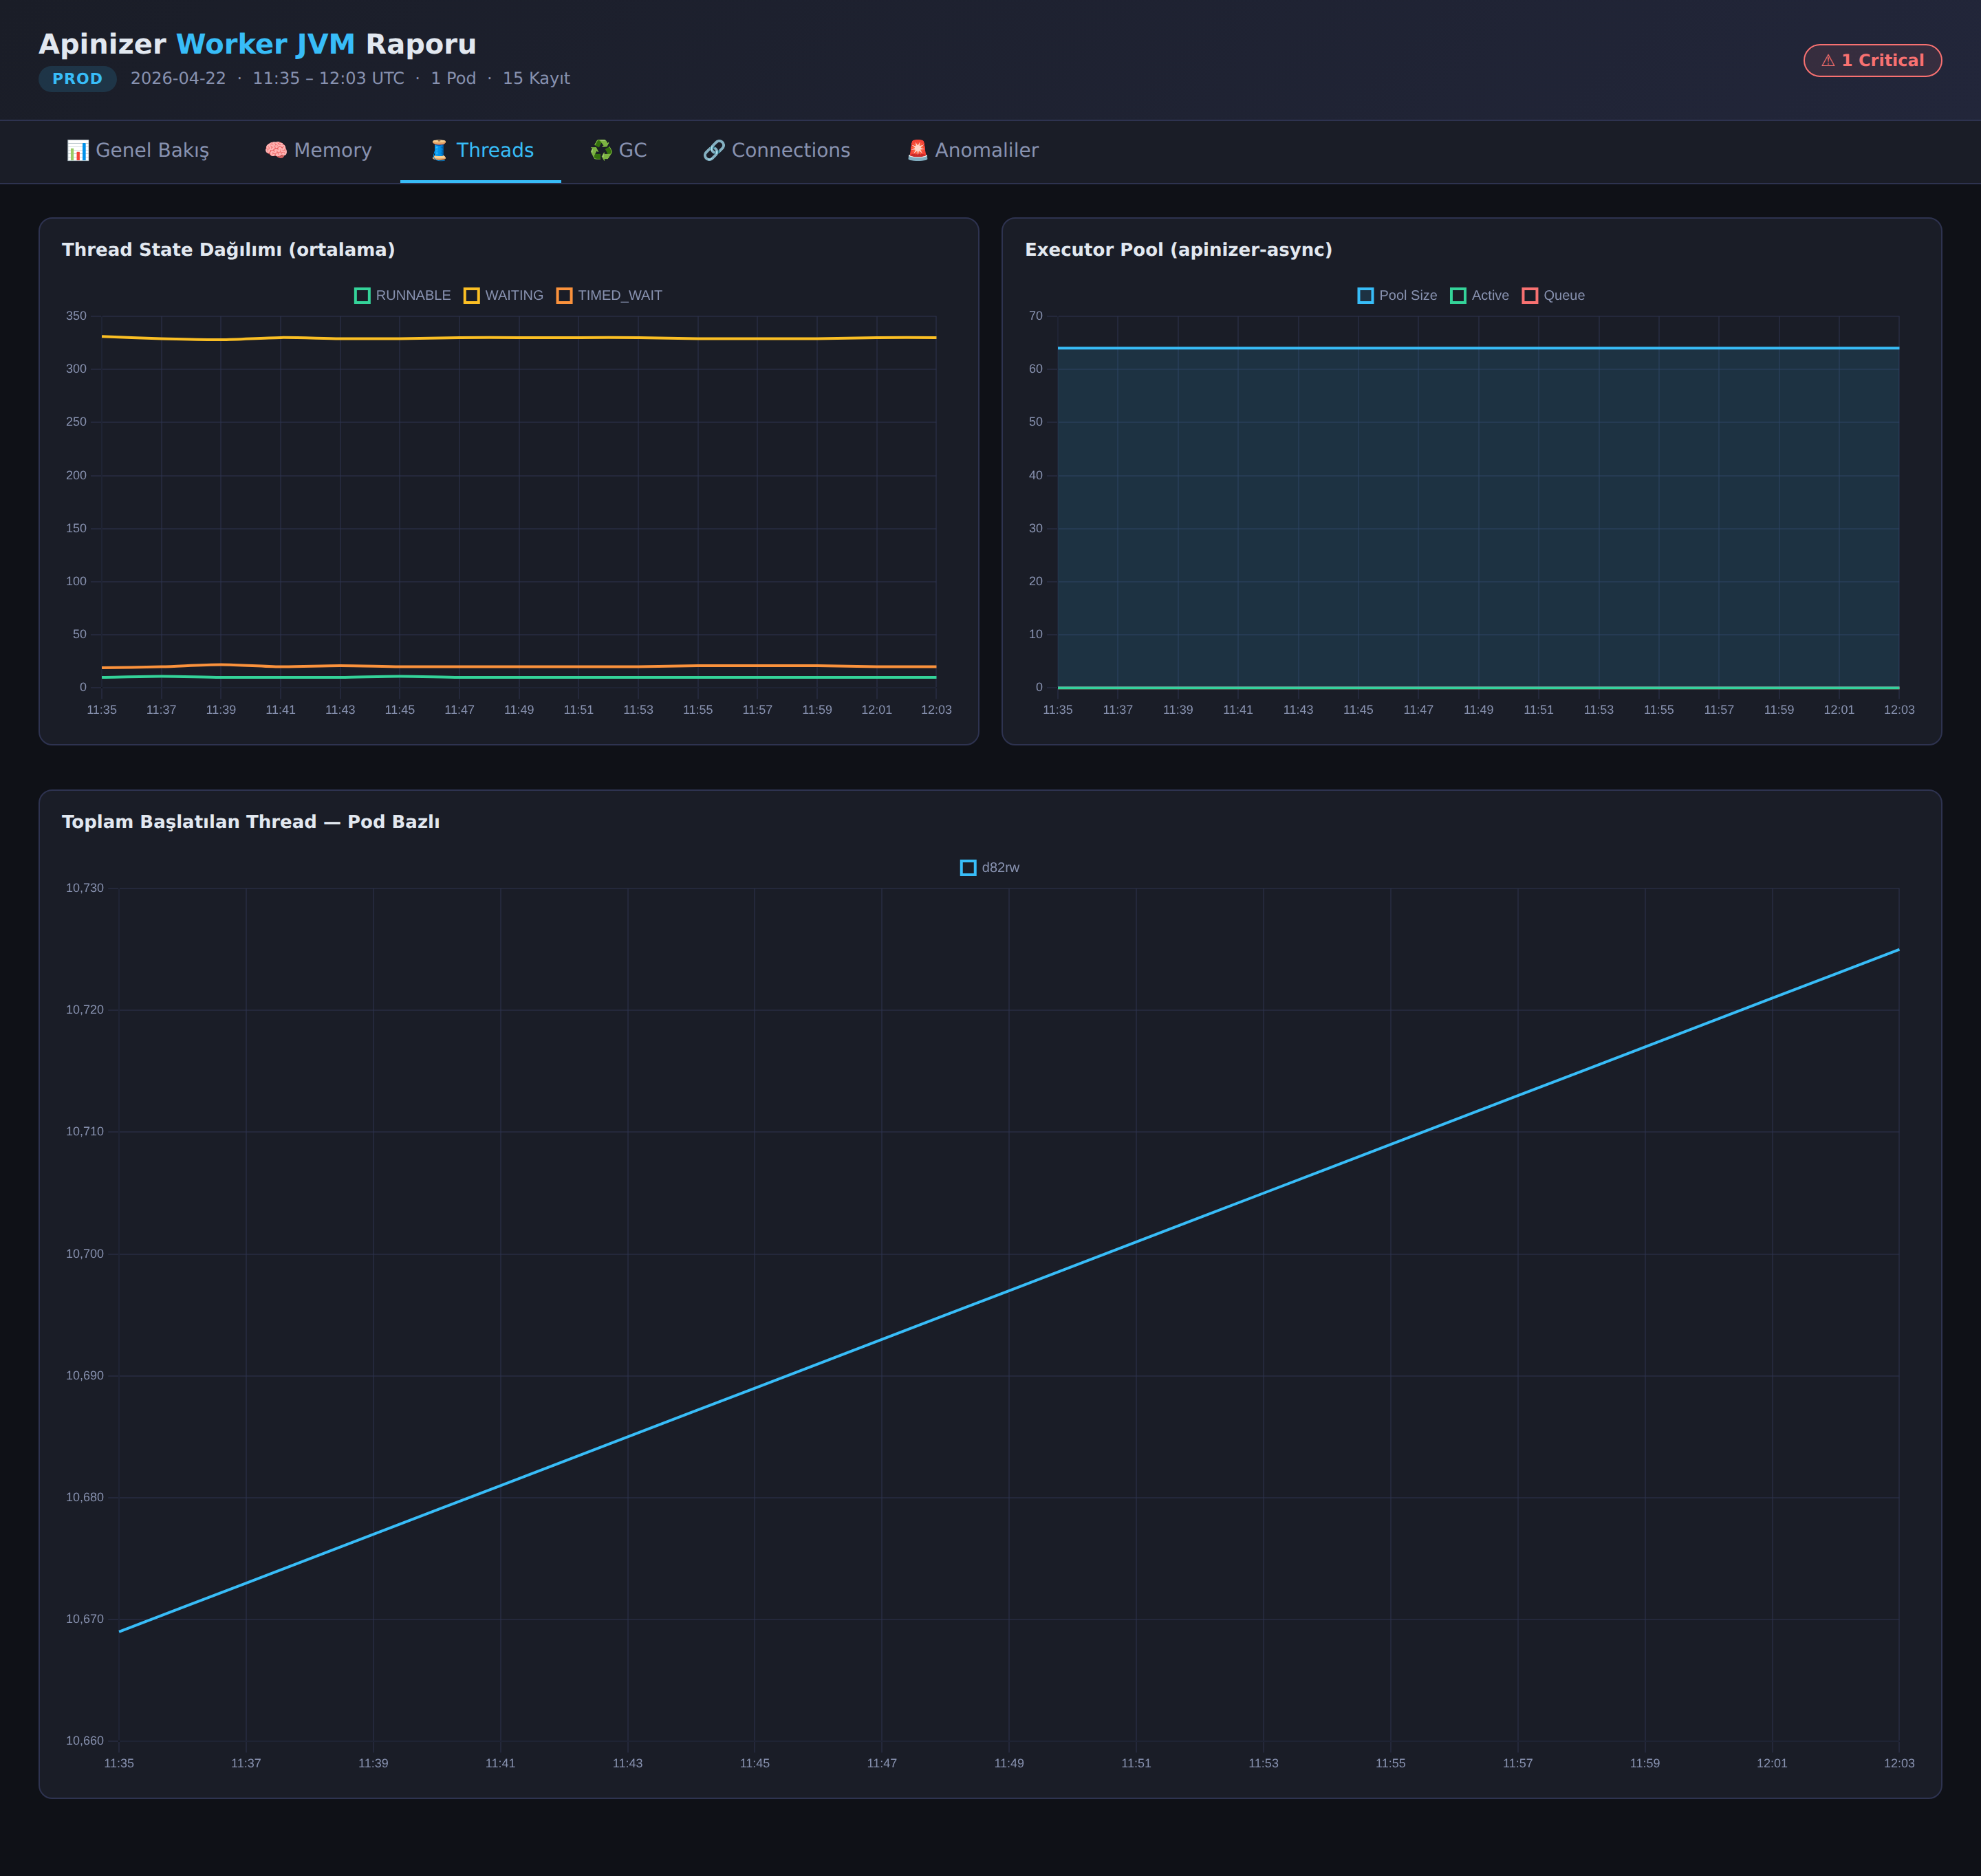
- Threads — Thread state distribution (RUNNABLE / WAITING / TIMED_WAITING),
apinizer-asyncexecutor pool status (pool size, active, queue), and total started thread count per pod.
- GC — G1 Young and Concurrent GC counters and cumulative GC time charts.
- Connections — Leased and available metrics of the HTTP connection pool and maintenance pool queue charts.
- Anomalies — List of metrics where threshold exceedance is detected; shows in which metric, in how many samples, and at which peak value the warning or critical level was reached. At the bottom of the page, there is a per-pod summary table.
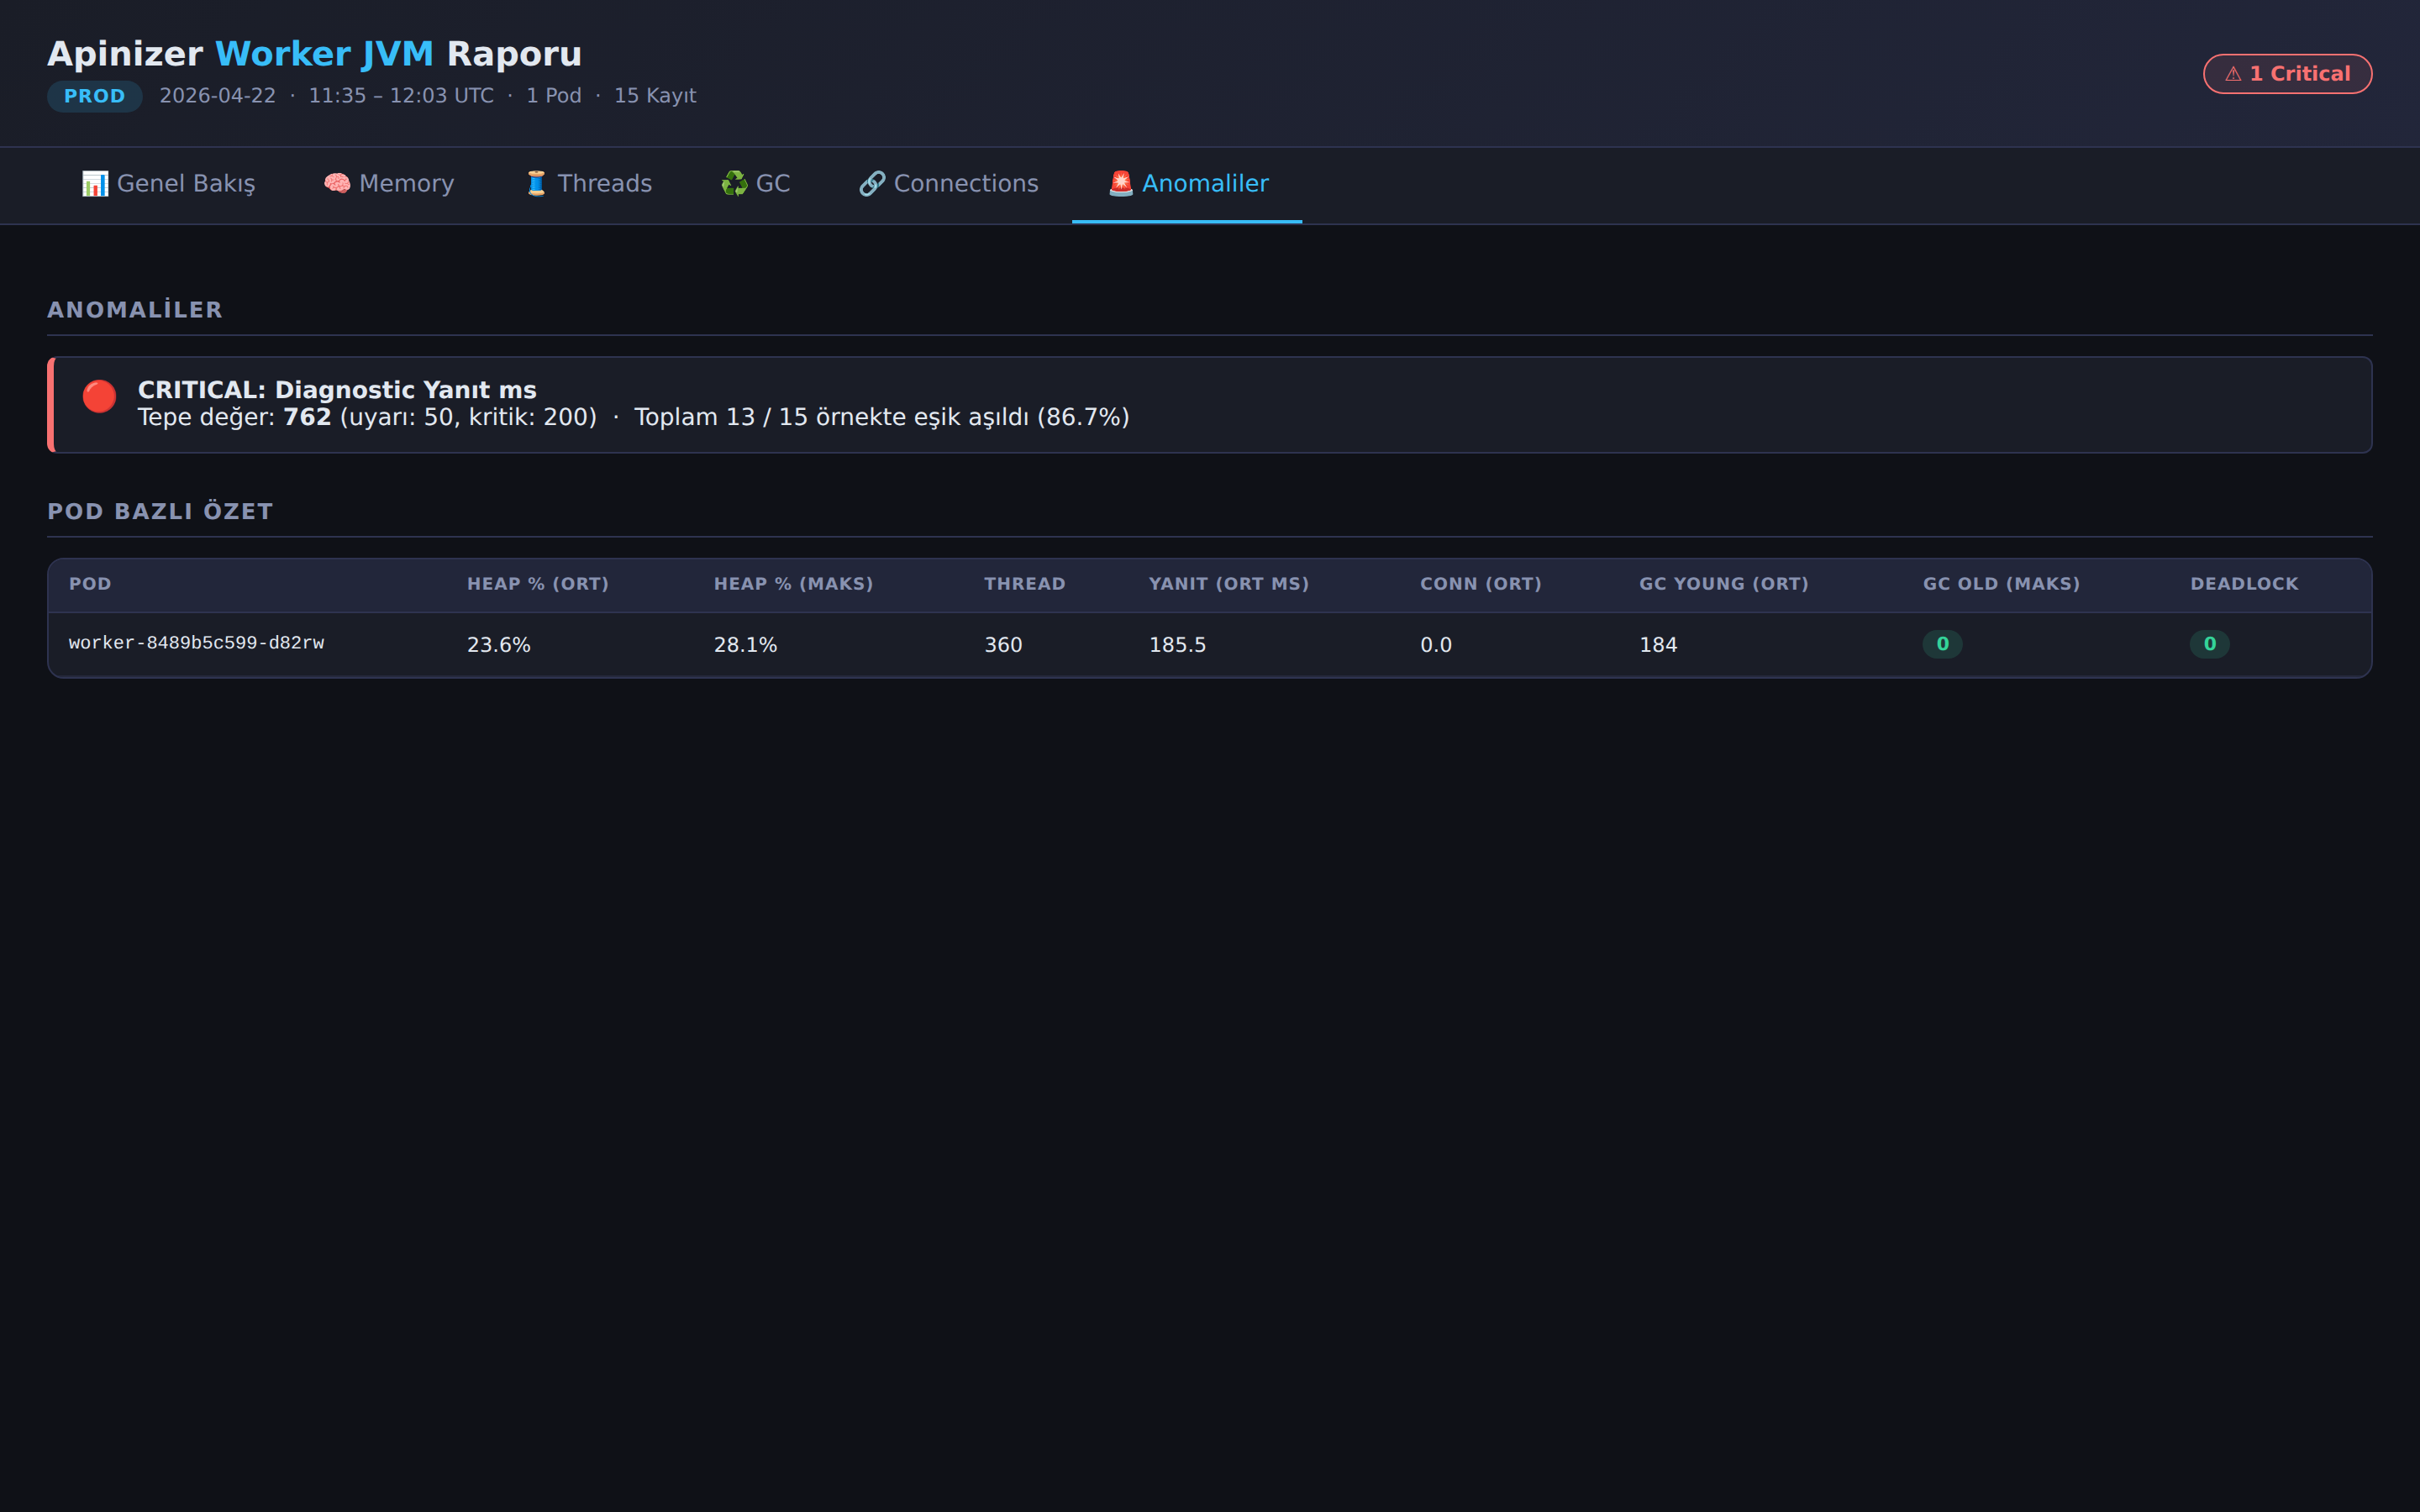
Tab contents work with "lazy build" logic: charts are created only when tabs are clicked. This way, even if the report contains thousands of data points, the initial load remains fast.
Comparing Multiple Environments
Since the report is now generated for a single environment, when you want to compare two environments, it is sufficient to generate a separate report for each environment and open the HTML files side by side:
./make-report.sh dev
./make-report.sh prod
# apinizer-worker-report-dev-20260422.html
# apinizer-worker-report-prod-20260422.html
This approach makes each environment's detailed report independently shareable/archivable; it is also more practical to send only their own report to the team of an environment.
8-) Troubleshooting
The errors below are the most common situations. For initial diagnosis, always check the console output of the collector script and the last few lines of the generated JSONL file.
ERROR: 401 Unauthorized — check the ENV_ID value.
The ENV_ID is incorrect or the ID of another environment was entered. Re-obtain the correct ID for the environment from the API Manager → Environments menu.
ERROR: Could not reach Worker ({WORKER_URL})
There is no TCP-level access to the Worker address. Network rules, Ingress/NodePort definitions, or proxy settings should be checked. Quick verification can be done by sending a manual request with curl -v "${WORKER_URL}/apinizer/diagnostics/all?internal=true".
ERROR: ENV_NAME, WORKER_URL, and ENV_ID are required.
monitor.sh was run without arguments or with missing arguments. If you have not filled in the DEFAULT_* values at the beginning of the script, you must pass all three arguments on the command line.
ERROR: <env>-worker-diagnostics-YYYYMMDD.jsonl does not exist. Is monitor.sh <env> ... running?
make-report.sh looks for the JSONL file of the specified environment. The collector may not have been started yet, may have been run with another environment name, or may be running in another directory. The collector script and the report generator must run in the same directory.
WARNING: At least 3 records are needed for meaningful charts.
If the collector has just been started, sufficient samples may not have accumulated yet. With the default 120-second interval, waiting at least 6 minutes is sufficient for a meaningful report.
Some pods do not appear in the report at all. If the Worker Deployment is running with multiple replicas, requests coming through a Service or Ingress are distributed to different pods. The collector may hit a random pod on each request; in short-term monitoring, some pods have a low chance of being sampled. To monitor per pod, additional collectors targeting each pod separately (e.g., via headless service or pod DNS) can be run.