API Proxy Traffic Log Settings
Regions Where Log Records Are Kept
API Proxy messages can be logged in the following regions:
Request messages coming from client to API Proxy
Request messages transmitted from API Proxy to Backend API
Response messages given from Backend API to API Proxy
Response messages sent from API Proxy to client
By default, logging of fields in all message regions of the project is active. Logged fields can be restricted according to need or based on the log server's resource consumption.
Production Environment Recommendations
Recommendations for Production Environment: It is recommended to disable logging of the following regions in production environment.
Since all policies' settings and tests are completed in API Proxies running in production environment, no development will be done. To prevent data from growing excessively in the database, logging of the following regions can be disabled:
- Request to Target: Requests transmitted from API Proxy to Backend API
- Response from Target: Responses given from Backend API to API Proxy
Not writing header, parameter, and body data in these two regions helps keep the database size under control.
Logging on Failure or Block
Logging Disabled Fields on Failure: Even when specific log fields are turned off, you may still want them recorded when a request is blocked by a policy or fails with an error, so that the cause can be analyzed. This behavior is now controlled per connector via the "Enable logging disabled fields on Block" and "Enable logging disabled fields on Failure" toggles, configured when the connector is added to the environment. See.
Formdata Requests
Formdata Requests: Due to variable data sizes and data formats, file parts of formdata requests are not logged in any way. Only other metadata fields are logged.
WebSocket and gRPC Requests
WebSocket and gRPC: Since WebSocket and gRPC requests are kept as data coming to Apinizer and data going out from Apinizer, only 2 regions exist in these types of API Proxies:
- Request from Client / Response to Client
- Request to Target / Response from Target
Streaming (SSE) Responses
On API Proxies that use server-sent events, the response body used to appear in the traffic record as the placeholder <<Server Side Streaming Operation Enabled>>. The event stream actually written to the client is now recorded:
- One single traffic record is produced for the whole stream, completed when the connection closes. No per-chunk record is created — correlation stays intact and long-lived connections do not grow the log volume without bound.
- The stream is captured only when at least one enabled log connector will actually record the Response to Client body for that request — according to the connector settings resolved for the request (method-level overrides included), or when the connector's log disabled fields on block/failure override is on. If body logging is off for the request, or the retention profile does not allow payloads, the placeholder is kept and no capture buffer is allocated.
- The recorded body is bounded by the maximum body size setting (
LOGGING_TRAFFIC_MAX_BODY_SIZE). Once the limit is reached, copying stops and the record ends with a<<Streaming Body Truncated>>marker, so a truncated body is never mistaken for a complete one. - AI Gateway proxies are covered as well: when the Streaming setting on the AI Proxy Routing screen is on, the response streamed from the LLM provider is recorded under the same gate (response body logging and retention profile), the same body limit and the same truncation marker. What is recorded is the stream actually sent to the client — the output of any masking/DLP policies that run on the response, not the provider's raw response.
- If the client disconnects or the backend fails, whatever was written up to that point still lands in the same single record.
With streaming body logging on, every stream holds a capture buffer of at most the maximum body size (LOGGING_TRAFFIC_MAX_BODY_SIZE, default 25 MB) in worker memory; when the stream closes, that buffer becomes a record text of the same size that stays in memory until the record is written. Rule of thumb: concurrent streams × min(stream body, body limit) — 100 concurrent long AI answers at the default limit can need up to 2.5 GB of heap. In environments where long streams are common, keep the recorded body small with the Partial size (sizeBodyToClient) setting of the Response to Client region on the relevant log connector rather than lowering the global limit; if the body is not needed, turn body logging off for those requests (no buffer is allocated at all). Exceeding the limit only shortens the record; the stream sent to the client is never affected.
Compressed SSE (streams carrying a Content-Encoding) is relayed transparently by the gateway. It cannot be safely decompressed and passed through the existing privacy/masking chain, so the placeholder is kept for those streams. Binary streams are not captured either.
When the retention profile disallows body capture (NO_PAYLOAD / NO_PERSIST), no buffer is created at all. PII masking is applied through the existing mechanism before the record is persisted.
Log Settings Tab
The Log Settings tab on the API Proxy detail page is a dedicated tab for managing traffic log configuration. The log settings section that was previously at the bottom of the Settings tab is now managed from this separate tab.
Three-Level Configuration: You can configure log settings at three levels:
- API Proxy level: General log settings for each API Proxy
- Environment level: Log settings specific to the selected environment (settings are stored per environment)
- Method level: Custom log settings for specific API methods (Method Overrides)
Log Settings Screen
Log settings can be configured in the Log Settings tab on an API Proxy basis and per environment. If integration settings have been made, which API Proxies' traffic records will be sent to these integration targets can also be configured.
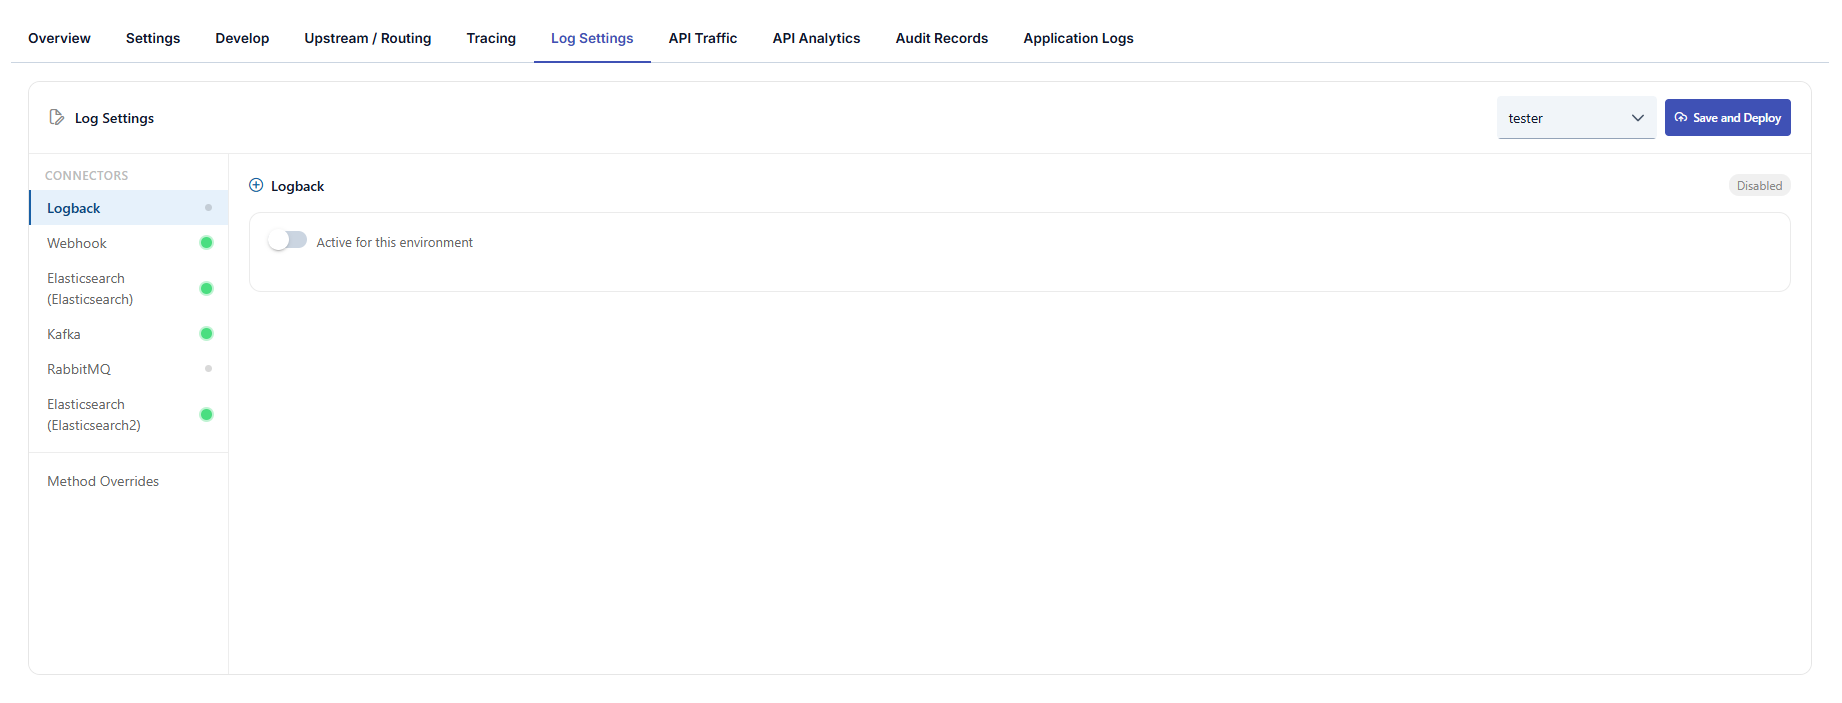
These settings apply not only to Elasticsearch but also to all connector types such as Kafka, RabbitMQ, Database, ActiveMQ, Syslog, Webhook, Logback, Graylog. The connector list is dynamically generated based on the connector instances defined in the environment; multiple connectors of the same type can be configured and each is managed independently.
When a database connector is selected as a log target, the schema prefix and custom table names for log tables are configured in the Connection definition. See Database Connection for details.
Screen layout
API Proxy top navigation: Overview, Settings, Design, Develop, Upstream / Routing, Tracing, Log Settings (active tab), API Traffic, API Analytics, Audit Records, Application Logs, and related items.
Top bar:
- Environment: Select the environment to which log settings apply; settings are stored per environment.
- Save and Deploy: Saves changes and triggers deployment to the selected environment.
Left panel — CONNECTORS:
- Connectors defined in the selected environment are listed (the example screenshot shows Elasticsearch, Database, and Graylog). The list is dynamic and reflects actual connector records in the environment.
- When multiple connectors of the same type exist, each may be shown with a distinguishing name; with a single instance, only the type name may appear.
- Method Overrides: Define log rules that differ from defaults for specific API methods; the number of overrides is shown as a badge.
Main area — selected connector (e.g. Elasticsearch):
-
Enabled status (e.g. green badge) and Active for this environment toggle to turn log delivery on or off for this environment.
-
Log Content Selection — independent groups (disabling one does not affect the others):
- HTTP Request Details — IP, method, URI, port, etc.
- Performance Metrics — duration, size, cache, etc.
- Response Status Info — status code, error type, etc.
- Routing Address
-
Request and response flow: Across the four message regions, Parameter, Header, and Body logging can be toggled separately; request-side regions typically offer all three, response-side regions typically Header and Body. Each region may include Partial Size to control partial (size-limited) recording for body/header.
-
Privacy: When enabled, a table defines masking or similar rules by element name and operation; use + Add for environment-specific privacy definitions. If none exist, an empty-state message is shown.
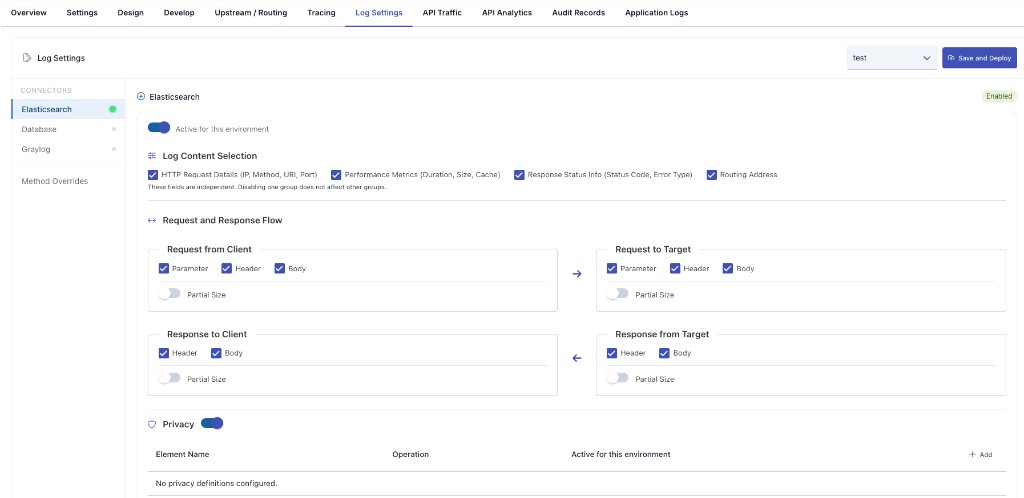
Log settings previously lived under the Settings tab; they are now on the Log Settings tab. For platform-wide defaults, see General Settings.
Connector Settings
The following fields can be configured independently for each connector instance:
| Field | Description |
|---|---|
| Enabled | Indicates whether the connector is available in this environment (e.g. green badge). |
| Active for this environment | Turns log delivery to this connector on or off for the selected environment. |
| Log Content Selection | Chooses whether to log top-level groups such as HTTP request details, performance metrics, response status info, and routing address, independently. |
| Partial Size | Enables or disables partial (size-limited) recording for header/body in the given message region. |
| Header | Enables logging of values in the Header field of the message in the related region. Manages whether header information in the message is logged or not. |
| Body | Enables logging of values in the Body field of the message in the related region. Manages whether body information in the message is logged or not. |
| Parameter | Enables logging of values in the Parameter field of the message in the related region. Manages whether parameter information in the message is logged or not. |
Method Overrides
You can define different log settings for specific API methods than the default connector settings. For example, you can disable body logging for a sensitive method while keeping it enabled for others.
- Add Method Override: Define custom settings by selecting a method and connector.
- Methods are listed with the HTTP verb in front of the path, for example
GET /pet/{petId}, so endpoints that share a path but differ by verb can be told apart. Methods that have no HTTP verb, such as SOAP operations, are listed by name only. - Header, parameter, and body logging can be configured separately for each override.
- Existing overrides can be edited or deleted.
Previously configured log settings are automatically preserved. Existing settings seamlessly transition to the new connector-based system with no additional action required.
Privacy Settings
Privacy settings can be made to protect sensitive data in API Proxy traffic logs. These settings are configured when connectors are added to the environment. Which fields will be logged and which fields privacy operations (masking, deletion, hashing, encryption) will be applied to can be determined.
How a Privacy Rule Finds Data
Each rule first decides what to look for, then what to do with it. You choose this with Rule type when adding a definition. There are three ways to find data:
| Rule Type | Matches | Use It When |
|---|---|---|
| Element name | A field, header or query parameter with a given name — whatever its value | The sensitive data always lives in a known field, such as password or cardNumber. This is the only type that matches by name, and it covers logged headers, parameters and the query string of the logged URL |
| Regular expression | Any text matching your pattern — in the body, in the request path or in the query string | The format is specific to your APIs — order codes, internal identifiers |
| Built-in PII type | A known personal-data format, wherever it appears | The value can land in any field, in a path segment such as /user/12345678901, or in free text such as an AI prompt |
Built-in types cover Türkiye ID number (TCKN), Türkiye IBAN, Türkiye phone number, e-mail address and credit card number.
Operations
- Mask — replaces the value according to the mask shape you choose (see below)
- Delete — removes the value
- Hash — stores a one-way hash; the original cannot be recovered
- Encrypt — stores a reversible encrypted value
- Detect — reports that the data was present without changing the logged content
Mask Shape
Masking is configured per rule and works identically across all three rule types (element name, regular expression, built-in PII type):
| Shape | Input | Output |
|---|---|---|
| Replace entirely (default) | 05321234567 | *** |
| Keep first N characters (N=4) | 05321234567 | 0532******* |
| Keep last N characters (N=4) | 05321234567 | *******4567 |
| Mask first N characters (N=4) | 05321234567 | ****1234567 |
The default shape replaces the whole value with *** and leaks nothing. Partial shapes preserve the output length and deliberately leave part of the value visible — useful when support needs to correlate a record, but since the remaining fragment can identify a person on its own, choose one on purpose. The replacement text is configurable too; in partial shapes its first character is used as the mask character.
If the number of characters to keep is greater than or equal to the value length nothing would be masked at all; in that case it falls back to the safe side and replaces the whole value.
How to read an encrypted value back is described on the Advanced Guardrails page — the same encryption and key apply to this screen.
Things Worth Knowing
The URL is covered too, but by different rule types. The logged query string is masked both by name (an id rule hides ?id=... exactly as it hides the parameter in the parameter list) and by pattern. The request path is masked only by regular expression or built-in PII type, because a path segment has no name to match on: to hide the identifier in /user/12345678901, define a built-in TCKN rule or a pattern such as [0-9]{5,}. The address actually sent to the backend (Routing Address) is covered by the same rules too. Only the path and query part of that address is masked, following exactly the same rules as httpRequestQueryString and httpRequestPathInfo; the scheme, host and port (the https://host:8443 portion) are never touched — that part carries no PII and is the key traffic lists and reports group backends by. Values that reach the URL percent-encoded (user%40example.com) are decoded before the pattern is applied, so a built-in e-mail rule catches them there too; if no rule matches, the logged URL is written exactly as it arrived.
Built-in types verify the value, not just its shape. TCKN, IBAN and credit card numbers are validated (check digits, mod-97, Luhn) after the pattern matches. A number that has the right shape but fails validation is deliberately left untouched, so ordinary 11-digit numbers, totals and reference codes are not destroyed in your logs. If a value you expect to be masked stays visible, first confirm that it is a genuinely valid number.
These rules apply to traffic logs only. They change what is written to Elasticsearch, Kafka and the other log connectors — not what the gateway returns to the client or sends to the backend. To mask data in the traffic itself, use the AI PII Mask policy or a transformation policy.
For detailed information, you can refer to the Adding Log Connectors page.
In the Log Settings section, log settings are managed on an API Proxy basis.
Overriding Environment Restrictions
The connector settings on this tab are not the last word. When a connector is added to a Gateway Runtime environment, the administrator can attach a detail filter and size limits to it — an environment-wide rule that narrows what any proxy is allowed to log, no matter what that proxy asks for.
Override environment restrictions, on the top bar of this tab, exempts this one API Proxy from that rule. It is the answer to a common situation: the environment keeps response bodies off to control log volume, but one integration is under investigation and needs full records for a while.
The switch works on its own: no connector-side setting or permission is required. Turning it on for this proxy is enough — it is exempted from every connector's detail filter and body size limits in this environment, while every other proxy keeps the restrictions unchanged.
What the override skips: the environment connector's detail filter (which fields it allows) and its body size caps. With the override active, this proxy's own log settings decide alone, and a body the environment would have truncated is recorded in full.
Privacy settings are outside this switch. Masking, hashing, deletion and encryption rules are applied to every record regardless of the override — they are a data-protection obligation, not a display preference, and a proxy-level switch cannot lift them.
The data retention profile is not affected either. While No Payload or No Persist is in effect, no body is captured at all, so there is nothing for the override to reopen.
The setting is off by default and lives on the proxy's own log settings record, which has its own delivery channel to the gateway. Saving is enough — no API Proxy redeploy is required, and the change applies to the very next request.
Data Retention Profile
The header/body/parameter settings on this tab operate within the data retention profile inherited from the project and global levels — you can make the profile stricter at the proxy level, but choosing a looser profile than the one you inherit is rejected on save.
While No Payload or No Persist is in effect, headers/body/parameters are never captured even if the Log Content Selection and Connector Settings above show them as enabled — Privacy rules (above) likewise find no data to act on in that case.