Clients Not Making Requests
Identities are read from Elasticsearch in batches of 512. That is the query batch size, not a limit on the report: every consumer and API client in scope is reported.
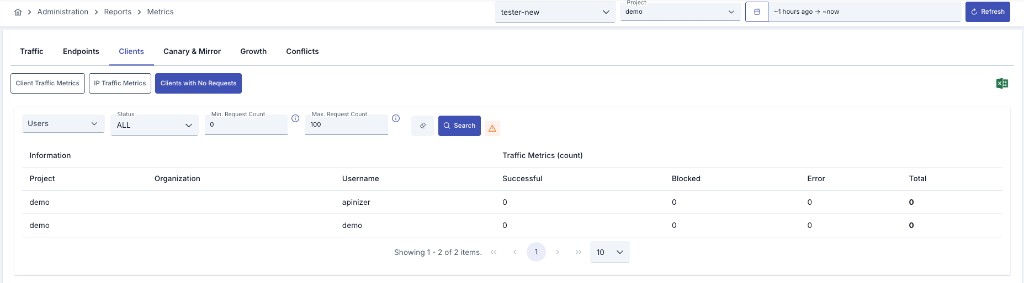
Since an API Proxy can be loaded into multiple environments, metrics must also be evaluated according to the environment it is loaded into. Therefore, in all analytics screens, metrics are filtered by first selecting environment information.
Metrics Page
This report is the Clients with No Requests sub-report on the Clients tab of the Metrics page (documented as Clients Not Making Requests). Open it via Administration > Reports > Metrics or Analytic > Reports > Metrics in the project menu, then select Clients with No Requests on the Clients tab.
Environment, project (Administration only), and date range on the top row are shared; report-specific filters sit on the sub-report row.
Filters
You can detect users who make no requests or low traffic based on the criteria below:
You must first select an environment to run the report. Environment selection is mandatory and metrics are filtered according to the selected environment.
Since an API Proxy can be loaded into multiple environments, metrics must also be evaluated according to the environment it is loaded into.
Multiple project selection is available for administrator users. When a project is selected, users in the selected projects are analyzed.
This filter is only visible for administrator users.
Limit the report to selected consumers. The list offers the consumers (clients) of the active project, not the Manager administrator accounts; global consumers are outside this report's project scope and are therefore not offered. Selecting a consumer also restricts which API client rows appear: only the keys owned by the selected consumers are listed. Leave empty to include all consumers.
Limit the report to selected consumer organizations. The list offers the organizations of the active project plus the platform-level ones, so this filter can only narrow what your project scope already shows. Leave empty to include every visible organization.
When on (the default), each consumer's API client keys are listed as separate rows, so a dead key can be spotted even when its owner is still active. Turn it off to see consumer identities only.
Filter by user status:
- ALL: All statuses
- ACTIVE: Active users
- INACTIVE: Inactive users
Lower bound (inclusive) for Total requests in the selected date range. For example, 0 includes users with no traffic.
Upper bound (inclusive) for Total requests. Min and Max together define a low-traffic band (e.g. 0–100).
Click Search to apply filters and reload the table. Excel Export on the shared filter row downloads the result list.
Report Table
Report results are displayed in the following columns:
| Field | Description |
|---|---|
| Project | Project the identity belongs to (Administration only) |
| Identity Type | Consumer for a consumer identity, API Client for a key owned by one |
| Organization | Organization linked to the identity (if any) |
| Username | Consumer username. On an API client row this is the owning consumer |
| API Client Key | The API client's key; empty on consumer rows |
| Created | When the identity was created |
| Last Used | Most recent request found in the traffic log, or Not used |
| Status | Enabled, Disabled or Expired for a consumer; Active or Suspended for an API client |
| Successful | Successful request count |
| Blocked | Blocked request count |
| Error | Error request count |
| Total | Total requests (Successful + Blocked + Error) |
Consumers That Only Call Through an API Client
A consumer can send traffic under its own username, under its credential record, or through the API client keys it owns. The report merges all three before deciding whether an identity is idle.
That matters when you are deciding what to revoke: a consumer whose own username is silent but whose API client is busy shows 0 in the traffic columns, yet it carries an information icon next to its username saying that one of its API clients is still in use. Revoking such a consumer would break a live integration, so treat the icon as "in use".
The API client's own traffic is counted on the API client row, not on its owner's row. This keeps the two questions separate: is the consumer identity itself still used, and is this particular key still used.
Reading "Last Used" and the Coverage Note
Last Used is derived from the traffic log in Elasticsearch, so it can only reach as far back as the traffic log is retained. An identity showing Not used produced no request inside the retained window; it does not prove the identity was never used.
When the date range you selected starts before the traffic log does, a warning appears above the table stating the date the traffic log actually begins at and, when the connector deletes old indices, the retention period in days. The same note is written to a separate Info sheet of the Excel export and is shown by the Report Generator, so a scheduled report carries the same caveat.
If the traffic log holds no record at all for the selected environment and scope, the report says so explicitly: the rows are still listed, but they prove nothing about usage.
The report cannot be run for environments where Elasticsearch integration is not active. In this case, a warning message is displayed on the screen.
The same report is available on the Management API as Clients With No Requests Report, for pipelines that revoke unused credentials automatically.