Gateway Traffic
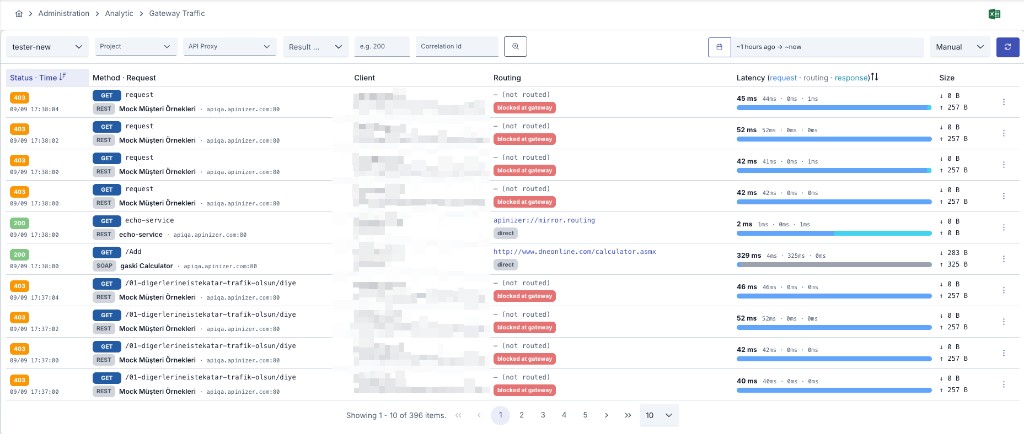
Since an API Proxy can be loaded into multiple Environments, metrics are queried per environment. The Administration menu adds a Project filter; the project-scoped screen covers only the active project.
List View
Open the screen via Administration > Analytic > Gateway Traffic or Analytic > Gateway Traffic in the project menu. The top bar includes environment, project (Administration only), API Proxy, result type, HTTP status code, and Correlation Id filters; the right side shows time range, refresh mode, and Excel export.
| Column | Description |
|---|---|
| Status · Time | HTTP status code (color badge) and request timestamp |
| Method · Request | HTTP method and proxy/method name; sub-line shows API type (REST, SOAP, …) and request server |
| Client | Client IP address and identity summary (API Client, anonymous, or legacy username/key) |
| Routing | Routing target; blocked at gateway or direct badge |
| Latency [request · routing · response] | Total duration (ms), phase breakdown, and bar chart |
| Size | Request and response body sizes (↑ / ↓) |
| Actions | Row menu — detailed view, JSON, download, quick test |
Features
You can view traffic of all API Proxies in the project on a single screen
You can reach the records you want with simple and advanced filtering options
You can examine each request's message flow in detail by sections
You can track how requests are routed to which addresses
You can view and download log records in JSON format
You can quickly retest requests by transferring them to Test Console
Routing Address
This field holds the address information to which the relevant API Proxy is routed. If this field is empty, it indicates that the request did not go to the backend address.
Services using Apinizer as backend are shown with the apinizer:// prefix, written exactly in the format apinizer://<COMPONENT_NAME>/<METHOD_NAME>.
This display is also valid for proxies whose routing is disabled to prevent going to backend.
Routing Address Values
| Routing Address | Condition |
|---|---|
apinizer://mirror.routing/<METHOD_NAME> | API Proxy type Swagger 2.x, OpenAPI/Swagger 3.0.x, WSDL, Reverse Proxy or No-Spec API and Routing option disabled and Mirror option enabled |
apinizer://specresponse.routing/<METHOD_NAME> | API Proxy type Swagger 2.x, OpenAPI/Swagger 3.0.x, WSDL, Reverse Proxy or No-Spec API and Routing option disabled and Mirror option disabled |
apinizer://db2api.apicreator/<METHOD_NAME> | API Proxy type DB2API |
apinizer://script2api.apicreator/<METHOD_NAME> | API Proxy type Script2API |
apinizer://mockapi.apicreator/<METHOD_NAME> | API Proxy type Mock API |
apinizer://connector/<METHOD_NAME> | API Proxy type Connector |
apinizer://maintenance | API Proxy in maintenance mode |
apinizer://cache/<METHOD_NAME> | Any API Proxy type and Caching enabled |
http://<BACKEND_ADDRESS>/<METHOD_NAME> https://<BACKEND_ADDRESS>/<METHOD_NAME> | API Proxy type Swagger 2.x, OpenAPI/Swagger 3.0.x, WSDL, Reverse Proxy, No-Spec API or KPS and Routing option enabled |
apinizer://spec | API Proxy type Swagger 2.x, OpenAPI/Swagger 3.0.x, WSDL, Reverse Proxy, No-Spec API and spec address access |
| (Empty) | Request cannot go to backend address for various reasons |
Since WebSocket and gRPC requests are stored as data coming to Apinizer and data going out from Apinizer, there are only 2 regions in these types of API Proxies.
API Type
Since this screen lists the traffic of every API Proxy in the project, records of different proxy types appear side by side. The API Type column shows which type each record belongs to, and the same values can be selected as a filter under Basic Filtering.
Values: SOAP, REST, GRPC, WEBSOCKET, MCP, A2A
The column is sortable, so records of the same type can be grouped together.
The API Type column and filter are only shown on this screen. In the Traffic tab of a single API Proxy the type is already fixed, and on the AI Gateway traffic screens the records are limited to the AI family — in both cases repeating the same value on every row would only be noise.
AI is not among the type options. AI Gateway traffic is deliberately kept out of this screen and is listed only on the AI Gateway's own traffic and analytics screens; therefore selecting AI here would always return zero records.
For WebSocket and gRPC records the Request Pipeline, Backend and Response Pipeline duration columns are shown as —. These protocols are logged as data arriving at and leaving Apinizer, so a three-phase pipeline duration is not measured for them.
Filtering
With the "More options" option, 2 different types of filtering can be performed:
- Basic Filtering
- Advanced Filtering
Records can be filtered with predetermined criteria such as a specific time range, endpoint, or HTTP method.
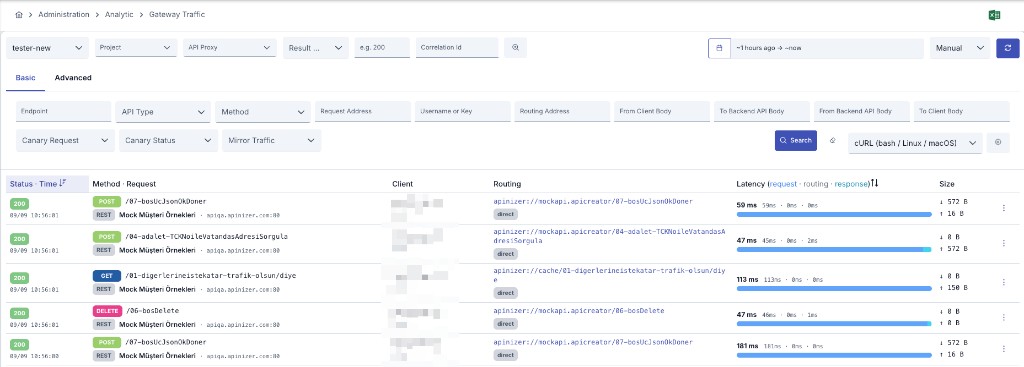
Filtering Criteria:
- Date Range: Start and end date selection
- API Proxy: Filtering for specific API Proxies
- API Type: Filtering by proxy type — SOAP, REST, gRPC, WebSocket, MCP, A2A (see API Type)
- Endpoint/Method: Filtering for specific endpoint or method
- HTTP Method: Besides HTTP methods such as GET, POST, PUT and DELETE, the list also contains WebSocket message types (OPEN, CLOSE, TEXT, BINARY) and gRPC call types (UNARY, CLIENT_STREAMING, SERVER_STREAMING, BIDI_STREAMING, UNKNOWN). gRPC requests whose call type cannot be determined when the record is written are stored as GRPC and can be filtered from the same list.
- Status Code: HTTP status codes such as 200, 404, 500
- Result Type: Successful, Failed, Blocked
- Canary Request: Filter by Canary Only or Non-Canary Only requests
- Canary Routing Status: Filter by one of Not Configured, Routed to Canary, Not Selected (Random), Circuit Open Fallback, Cooldown Period Fallback, Error Threshold Failback
- Mirror Traffic: Filter by Mirror Only or Non-Mirror Only requests
The Clear button resets these three filters along with the other Basic filter fields; it does not touch the Advanced Filtering criteria.
Users can create nested filters and perform complex queries.

The advanced filter creation tab is activated if there is an advanced license on analytics.
Advanced Filtering Options:
- API Proxy: Multiple API Proxy selection
- Method/Endpoint Name: Method/Endpoint Name
- HTTP Method: HTTP Method
- HTTP Status Code: HTTP Status Code
- Operation Result Type: Result Type
- Request Address: Request Address
- Sent Address: Routing Address
- API Client: API Client used for authentication (legacy records may show username/key)
- Correlation ID: Apinizer Correlation ID
- Request Body from Client: From Client Body
- Request Body to Backend API: To Backend API Body
- Response Body from Backend API: From Backend API Body
- Response Body to Client: To Client Body
- Complex queries with AND/OR/NOT operators
The Clear button resets the advanced criteria and the hidden drill-down filters that arrive from dashboard charts; it does not switch tabs, so you stay on Advanced Filtering. If the list is refreshed before any criterion is built (auto refresh, pagination, date range), the query runs without a criteria filter.
The tab that is open on screen decides which filter set is applied: while Basic Filtering is open the basic fields (HTTP Method, Result Type, Status Code and so on) apply, and while Advanced Filtering is open the criteria apply. The fields of the two tabs are never mixed.
Query Types
2 types of queries are applied to filtered fields:
Term Query
Logs where the searched value (keyword) exactly matches the logged data are returned.
Fields where this query is applied:
- API Proxy
- Operation Result Type (Result Type)
- HTTP Status Code (HTTP Status Code)
- HTTP Method (HTTP Method)
- API Client (legacy records: Username or Key)
- Correlation ID
Match Query
It is a query that searches across all text. The searched value is analyzed before searching.
Analysis Process:
- Text is broken into parts according to grammar rules (numbers, punctuation marks, etc.)
- Parts pass through the 'Lower Case Token Filter' stage and are converted to lowercase
- Example:
'The 2 QUICK Brown-Foxes jumped over the lazy dog's bone.'→[ the, 2, quick, brown, foxes, jumped, over, the, lazy, dog's, bone ]
Matching Logic:
- There is an OR operator between parts
- A score value is obtained based on criteria such as how many parts are in the field in the log document and how frequently they are used
- Relevant documents are returned according to this score value
Fields where this query is applied:
- Method/Endpoint Name (Method/Endpoint Name)
- Request Address (Request Address)
- Sent Address (Routing Address)
- Request Body from Client (From Client Body)
- Request Body to Backend API (To Backend API Body)
- Response Body from Backend API (From Backend API Body)
- Response Body to Client (To Client Body)
Wildcard Query
Documents containing terms matching a wildcard character pattern are returned.
Usage:
- The
*character must be added before or after the word to expand your search results - Example:
user*→ all words starting with user - Example:
*admin→ all words ending with admin
Fields where this query is applied:
- Request Address (Request Address)
- Sent Address (Routing Address)
Body Field Search
Body Field Search
The following rules apply when searching in the From Client Body, To Backend API Body, From Backend API Body, and To Client Body fields:
The four fields behave identically; each one searches only its own region of the message (1. request from client, 2. request to backend API, 3. response from backend API, 4. response to client).
Single-word search:
- Expressions without spaces, such as
birth, work as a case-insensitive substring search — all records containing that word are returned. - Values containing punctuation, such as
ABC-123,user@example.comor"orderId":5, are also matched as a phrase of their parts, so they are found even though the log text is split into words for indexing.
Multi-word phrase search:
- Expressions containing spaces, such as
date of birth, search for records where the words appear adjacent to each other — phrase search behavior. - Wildcards can also be combined:
*date of birth*
Explicit wildcard patterns:
- When the expression contains
*or?, it is used as-is as a wildcard pattern (case-insensitive):ord*123.
For the most accurate results, use the exact wording of the text you are looking for. Casing does not matter.
Body searches ignore casing on every supported Elasticsearch version. Searches on API Client / Username or Key, header values and parameter values ignore casing on Elasticsearch 7.10 and later; on Elasticsearch 7.0–7.9 they match the lowercase form of the stored value only, because those versions do not support the case-insensitive option and Apinizer automatically retries the search without it.
Detailed View
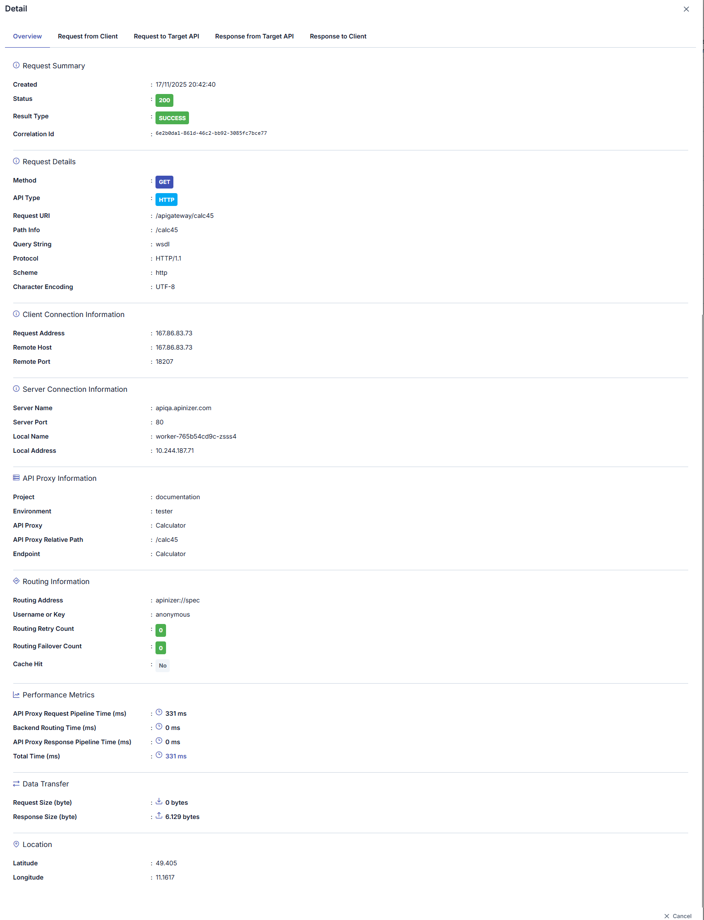
When the Detailed View button on the right side of the log record is pressed, the message's log information comes grouped by sections in the request and response line.
If Elasticsearch does not respond in time, the window no longer opens empty: it shows "Could not load the log detail because Elasticsearch did not respond in time. Please try again in a moment." If Elasticsearch returns an error, it shows "Could not load the log detail because Elasticsearch returned an error (HTTP ...). Please check the Elasticsearch server and try again." with the actual status code. If the record was genuinely deleted or never written, behavior is unchanged: the window still opens with empty content.
Message Regions
The log record is grouped according to the following regions:
Summary information of the request, status code, total duration, and general metrics
- Request Headers
- Request Parameters
- Request Body
- Client IP and metadata
- Backend URL and routing information
- Sent Headers
- Sent Body
- Routing details
- Response Status Code
- Response Headers
- Response Body
- Backend response time
- Headers returned to client
- Body returned to client
- Total processing time
By default, the Overview section is open. When the name of the section to be examined is clicked, log records related to that area are displayed.
Type-Specific Details
For records whose API Type is MCP or A2A, the Overview section also contains the protocol fields recorded by the Gateway. These sections are only shown for the relevant type; for other types they do not appear at all.
- MCP Details
- A2A Details
| Field | Description |
|---|---|
| Tool Name | The name of the MCP tool the request targets |
| JSON-RPC ID | The id value of the JSON-RPC envelope — used to match the request with its response |
| Field | Description |
|---|---|
| Task ID | The identifier of the A2A task |
| Context ID | The context identifier that groups tasks belonging to the same conversation |
| Task State | The state of the task at the end of the request (e.g. TASK_STATE_COMPLETED) |
If the request does not carry these fields (for example a protocol-level initialize call rather than a tool invocation), the section states that no type-specific data was recorded instead of showing empty fields.
Routing Diagnostics
If a request to the backend has routing diagnostic signals, a Routing Diagnostics section is shown in the Detailed View window.
This section is only shown for requests that go to the backend; requests served from cache or that never reach the backend (mock, maintenance mode, etc.) do not show this section.
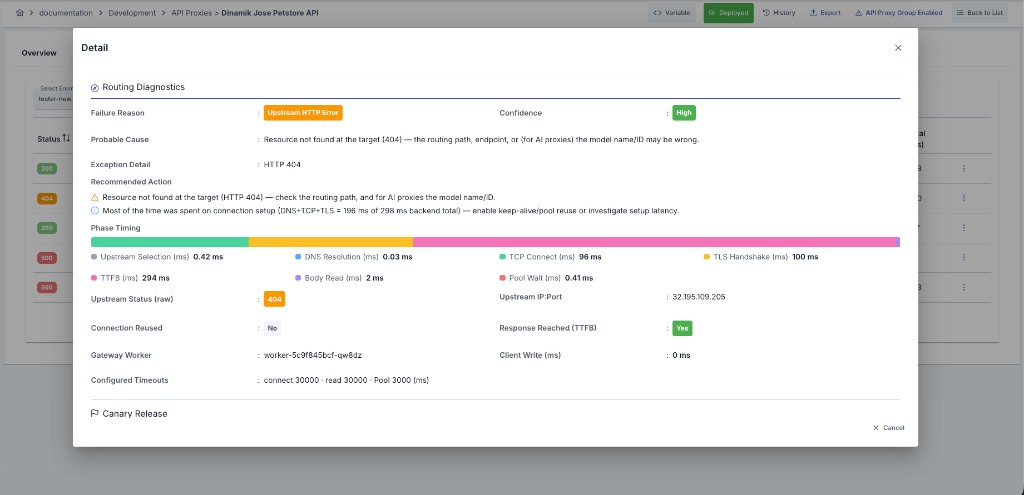
| Field | Description |
|---|---|
| Failure Reason | If the request failed, the classified failure reason (Pool Timeout, Connect Timeout, DNS Failure, TLS Handshake Failure, Read Timeout, Backend/Client Closed, No Healthy Upstream, Circuit Open, Retries Exhausted, Upstream HTTP Error, Unknown) |
| Confidence | The reliability level of the classification (High/Medium/Low) |
| Probable Cause | An automatically generated explanation based on the failure reason |
| Exception | If present, the exception class and detail that caused the failure |
| Recommended Action | A suggestion generated from the available signals to help resolve the issue |
| Phase Timing | The duration (ms) of each of: selection, DNS, TCP connect, TLS handshake, time to first byte (TTFB), body read, and pool wait |
| Upstream Status (raw) | The raw HTTP status code returned by the backend (may differ from the code returned to the client, e.g. if a policy changed it) |
| Upstream IP:Port | The backend address the request was actually sent to |
| Connection Reused | Whether the connection was reused from the pool |
| Response Reached (TTFB) | Whether at least one byte of the response was received from the backend |
| Gateway Worker | The Worker pod/host that processed the request |
| Client Write (ms) | Time spent writing the response to the client |
| Pool | The connection pool's instantaneous state: leased, pending, available, and maximum connection counts |
| Configured Timeouts | The connect, read, and pool-lease (connection-request) timeout values (ms) configured for the API Proxy |
For an aggregate routing diagnostics summary for this API Proxy (failure reason distribution, phase latency p50/p95/p99, etc.), see the Analytics tab.
JSON View
When the JSON View button on the right side of the record is pressed, the JSON version of the log record appears on the screen.
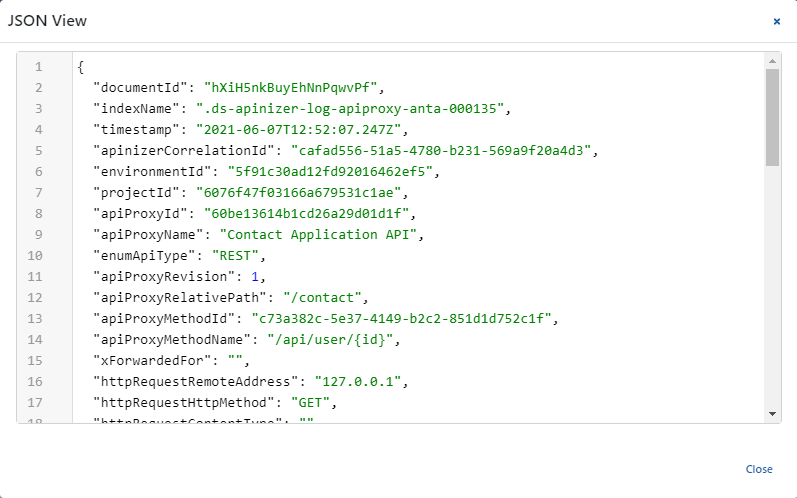
The key values in this area are written in a readable format to facilitate reading, not as they are in the log file.
For example:
- The "apiProxyId" value is stored as "api" in the log record
- When the log record is downloaded, the actual stored log record will be displayed
For the actual log file format, you can examine the "Template Data Structure Table" on the API Traffic Log Record Data Structure page.
If the data size of the log record is greater than 500KB, the Show Details and View in JSON Format options become disabled. In this case, the log record must be downloaded for examination.
Log Record Download
When the Download button on the right side of the record is pressed, the JSON version of the record is downloaded in .zip format.
Download Options:
- Single Record: Downloads the selected record
- All Results: Downloads all filtered records
Downloaded log files can be used for detailed analysis or processing with external tools.
Excel Export
With the Excel button at the top right of the screen, the result of the current query is exported as a spreadsheet. The export uses the same filters as the list, not only the records on the visible page.
Exported columns, in order: HTTP Status Code, Created, HTTP Method, HTTP Request Server Name, HTTP Request Server Port, API Proxy, API Proxy Method, Request Address, API Client, Routing Address, API Proxy Request Pipeline Time (ms), Backend Routing Time (ms), API Proxy Response Pipeline Time (ms), Total Time (ms), Request Size (byte), Response Size (byte), API Type. (Column headers in the file are in English; older exports may show the identity column as Username or Key.)
API Type is the last column. It was added after the other columns intentionally: the position of the existing columns does not change, so exports processed by an external tool are not affected.
Quick Test
When the Quick Test button on the right side of the record is pressed, the Test Console screen opens with the original message content that came to the record placed in the Test Console.
This feature facilitates retesting the relevant record.
The Quick Test button must be enabled in general settings to appear.
While the record's original message content is reloaded from Elasticsearch, if Elasticsearch does not respond in time or returns an error, the Test Console still opens but with an explanatory error message — content is never silently blank. This is the same Elasticsearch-timeout behavior as in Detailed View.
The request body that Quick Test fills in comes from the traffic record, not from the request itself. The body may have been shortened while the record was written:
- If a body size limit is enabled for that region in the API Proxy's traffic log settings, the body is cut at that number of characters.
- If the installation-wide absolute body ceiling is exceeded, the body is cut as well.
- For AI-type proxies only the last N messages of the conversation are logged (the message limit in general settings); older messages are removed from the record.
When the body looks incomplete, a warning appears at the top of the Quick Test window and you are asked to confirm before the request is sent — what would be sent may not be identical to the original call, so the result may differ. The same warning also appears when the client itself sent an incomplete body (for example a malformed request the API rejected), because the record alone cannot tell the two apart. If you want later requests to be recorded in full, review the size limit in the relevant traffic log setting.
Related Resources
Traffic tab of a single API Proxy
API Proxy performance metrics and visualization
Detailed trace and debug operations
Advanced query and filter definitions
Log record configurations
API traffic log record data structure