Queries
Project menu: Analytic → Query Editor → Queries (/custom-query)
Administration mode: Analytic → Query Editor → Queries (/admin/custom-query)
Create a query from Create on the list; save from the edit screen with Save and Deploy. Saved queries show an Audit and Rollback tab.
You can create and manage condition sets to analyze log records.
During testing you can define filters inline or pick saved filters for time range, API Proxy, and result type.
You can run the query with Try it after choosing an environment, then review the result table or export to Excel.
You can move query definitions to Admin scope so they are available in all projects.
Use Cases
Query Editor definitions are used on:
- Anomaly Detector — abnormal situation detection
- Report Generator — customized reports
- API Proxy trace filter — which live requests are traced
All query definitions can be moved to Admin scope with Globalize. Globalized queries leave the project list; administration moves to the system administrator.
Query Creation and Testing
The edit screen General tab contains name, description, conditions, test filters, query result fields, and the test section. After adding conditions you can use Try it for a quick check, then select a filter row and environment to execute the query.
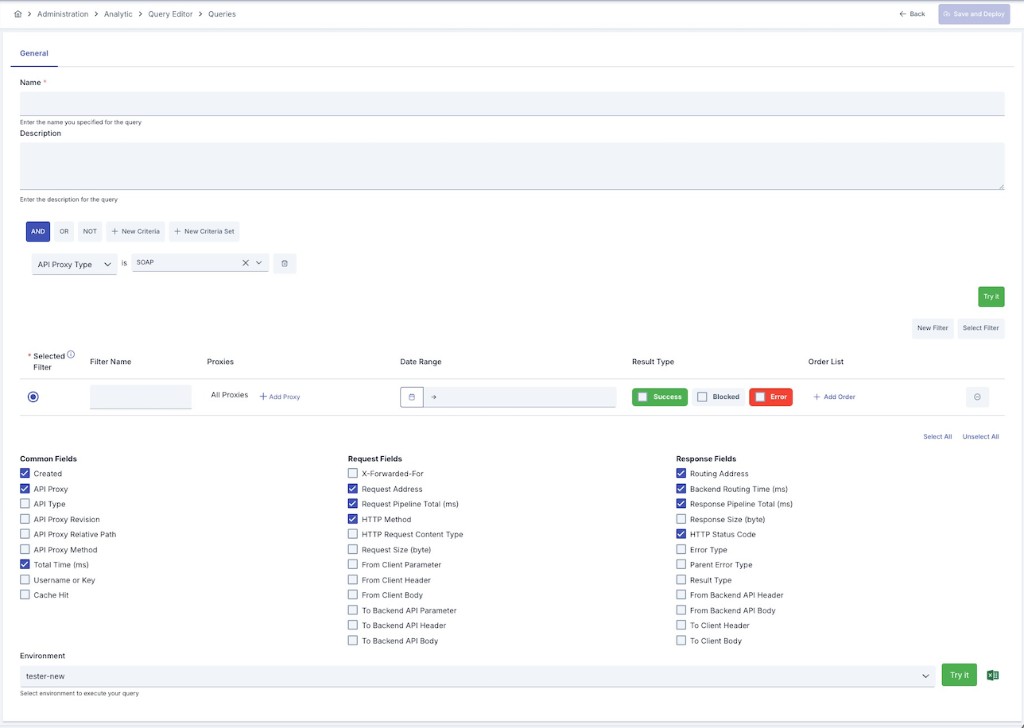
Configuration Fields
| Field | Description |
|---|---|
| Name | Unique name of the query. |
| Description | Optional description. |
| Conditions | Criteria the log record must match; Must, Should, and Must Not groups plus Try it validation. |
| Filters | For testing only: New Filter, Select Filter, or inline rows. Mark the row to run with the Filter Selection radio button. See Filters. |
| Query Result Fields | Log fields shown in the test table; Select All / Unselect All and Common / Request / Response groups. |
| Test | Environment selection, Try it (execute query), and Excel export. A warning appears when Elasticsearch integration is missing. |
Query Criteria
Condition rows can use API Proxy name, client IP, HTTP method, status code, duration, size, and API Proxy Type (REST, SOAP, gRPC, WebSocket, AI, MCP, A2A).
All conditions must be satisfied
At least one condition must be satisfied
Conditions must not be satisfied
Keyword criterion — message region and part
A Keyword condition searches one part of one message region. Choose the region first, then the part.
| Region | Header | Parameter | Body |
|---|---|---|---|
| 1. Request from Client | ✓ | ✓ | ✓ |
| 2. Request to Backend API | ✓ | ✓ | ✓ |
| 3. Response from Backend API | ✓ | — | ✓ |
| 4. Response to Client | ✓ | — | ✓ |
- Header and Parameter parts require the header/parameter name; the operator is applied to its value. Responses carry no query parameters. The name field is mandatory for these two parts: leaving it empty shows a required-field warning under the field and the search does not run.
- Body parts search the full text of that region's body (case-insensitive; values with punctuation such as
ABC-123are matched as a phrase,*/?give explicit wildcard patterns). - Header and Parameter values are matched case-insensitively on Elasticsearch 7.10 and later. On Elasticsearch 7.0–7.9 only the lowercase form of the stored value matches, because those versions do not support the case-insensitive option; Apinizer retries the search without it automatically, so the query still runs.
- The same condition is used by the API Proxy trace filter: a request is traced when its live messages satisfy the criteria. A region that does not exist for a request (for example the backend request of a blocked call) never matches.
Besides fields such as API Proxy name, client IP, HTTP method, status code, duration and size, condition rows can also use API Proxy Type. This field lets you narrow traffic down to REST, SOAP, gRPC, WebSocket, AI, MCP or A2A; several types can be selected at once.
To see the routing target, select the route address field under Query Result Fields.