Alarm
Overview
Monitor pod and node health statuses
Track cluster health and resource usage
Monitor CPU and disk usage rates
Track SSL and JWK certificate durations
Monitor application log counts
Receive instant notifications when threshold values are exceeded
What is Alarm?
Basic Concept
Alarm is a monitoring system that continuously checks specific conditions in your system and sends notifications when these conditions are met.
When to Use?
Monitoring pod, node, and Elasticsearch health statuses
Tracking CPU and disk usage rates
Tracking SSL and JWK certificate durations
Monitoring application log counts
Receiving warnings before problems occur
Receiving automatic notifications in critical situations
How Does It Work?
Trigger type, threshold value, scheduling, and notifications are determined
Automatic checks are performed at specified times (e.g., every hour)
A specific metric or status is checked according to the trigger type
If there is a threshold value, it is checked whether the checked value exceeded the threshold value
When the threshold is exceeded or status changes, configured notifications are triggered
All checks are recorded in history
Quick Start
Creating Your First Alarm
Click Main Menu → Monitoring → Alarm
Click the "Create New" button
- Name: A name for the alarm (e.g., "Elasticsearch CPU Monitoring")
- Description: Optional description
Select the trigger type (e.g., Elasticsearch CPU Percentage)
Enter the threshold value (e.g., 80)
Determine the check frequency (e.g., Every hour)
Click the "Save" button
Creating New Alarm
Step 1: Basic Information
Name - Required
Enter a unique name for the alarm. This name:
- Must be unique within the project
- Cannot start with a space
- The system automatically checks the availability of the name
Good Name Examples:
Elasticsearch CPU MonitoringKubernetes Pod Health StatusSSL Certificate Duration TrackingApplication Log Count Monitoring
Description - Optional
You can enter descriptive information about the alarm:
- Maximum 1000 characters
- Used to explain the purpose and scope of the alarm
- Displayed on the list page
Example Descriptions:
Created to monitor CPU usage of Elasticsearch clusterUsed to track health status of Kubernetes podsConfigured to warn before SSL certificates expire
Status - Default: Active
Determines the active/passive status of the alarm:
- Active: Alarm runs, scheduled checks are performed
- Passive: Alarm is stopped, no checks are performed (historical data is preserved)
Step 2: Trigger Type and Threshold Value
Trigger Types
Determines when the alarm will be triggered. The trigger type picker is searchable and groups the types into three categories; each type is shown in lists with a category badge:
- Infrastructure: Kubernetes pod/node health, K8S Node CPU, Elasticsearch health/CPU/disk, Gateway Thread Count, Gateway Heap Usage Percentage, Gateway Deadlock Count, Gateway Executor Pool Saturation Percentage, Gateway Connection Pool Usage Percentage, Gateway GC Time Percentage
- Platform: API Traffic (logs in database), SSL/JWK remaining duration, application log count
- AI: AI Gateway metrics (token usage, daily cost, guardrail/PII count, provider failover, quota, catalog drift, shadow AI)
- Pod / Node Health Status
- K8S Node CPU Percentage
- Elasticsearch Health / CPU / Disk Percentage
- Gateway Thread Count
- Gateway Heap Usage Percentage
- Gateway Deadlock Count
- Gateway Executor Pool Saturation Percentage
- Gateway Connection Pool Usage Percentage
- Gateway GC Time Percentage
- API Traffic (Logs in Database)
- SSL / JWK Certificate Remaining Duration
- Application Log Count
- AI Token Usage Percentage / Daily Cost
- Guardrail / PII Detection Count
- Provider Failover, Quota, Catalog Drift, Shadow AI
Kubernetes Trigger Types
Pod Health Status: Checks the health status of Kubernetes pods. Alarm is triggered when any pod becomes unhealthy. Does not require threshold value.
Only pods belonging to Apinizer components are evaluated; pods of other applications that share the same namespace, and pods that have already run to completion (Succeeded), are left out of scope. Pod readiness is read from Kubernetes' own pod-level Ready status, so APM/service-mesh sidecar containers injected into the pod do not change the outcome.
Node Health Status: Checks the health status of Kubernetes nodes. Alarm is triggered when any node becomes unhealthy. Does not require threshold value.
K8S Node CPU Percentage: Checks the CPU usage percentage of Kubernetes nodes. Alarm is triggered when CPU usage percentage exceeds the threshold value. Requires threshold value (e.g., 80 = 80%).
Gateway Diagnostics Trigger Types
Gateway diagnostics triggers share one mechanism: each reads a live JVM/pool figure from every API Gateway worker pod through the Gateway Management API address(es) defined on the environment (Environment > Management API settings), on every run, and evaluates each pod (or pod/pool combination) separately. An optional Environment selector limits the check to one environment; when left blank, every published environment is checked. A pod or address that cannot be read is listed as Warning without a value and does not trigger the alarm by itself; the run is recorded as Error Occurred only when no pod at all could be read (for example when every address is unreachable, the environment has no management address, or the selected environment was deleted). Reads time out after 70 seconds. Does not require a connection definition, but the environment must have at least one Gateway Management API address.
The row detail distinguishes two different Warning causes so a healthy pod is never mistaken for a down one: "unreachable: ..." means the address itself could not be reached (network error, HTTP error, or timeout), while "responded, but ..." means the pod answered normally but the specific figure this trigger needs was not present in its response (for example an old worker build that predates a newer diagnostics field) — the pod itself is up.
Gateway Thread Count: The live JVM thread count of each pod. The alarm is triggered when the
thread count of any pod exceeds the threshold (strict comparison: a pod exactly at the threshold
is shown as Warning, not triggered). Requires threshold value (e.g., 2000 = 2000 threads). The
alarm history lists each pod with its environment, IP and measured thread count. E-mail and webhook
templates render the threshold as <n> threads.
Gateway Heap Usage Percentage: Heap usage of each pod's JVM, as used heap divided by max heap ×
100. Threshold unit is %; recommended threshold 85. A pod whose JVM reports no heap ceiling (max
heap of -1, i.e. no -Xmx set) is listed as Warning rather than evaluated.
Gateway Deadlock Count: The number of deadlocked JVM threads on each pod. Threshold unit is
deadlocks; when you pick this trigger on a new alert the threshold is set to 0 automatically (a threshold you typed or a saved one is left as is), so the very first deadlock fires the alarm — unlike
the percentage triggers below, there is no separate warning band above the threshold, only Normal (0
deadlocks) and Breached (1 or more).
Gateway Executor Pool Saturation Percentage: Each registered executor pool of each pod, as
active threads divided by pool capacity × 100 — one row per pod and pool (for example
pod-1 / async, pod-1 / logDispatch). Capacity is the pool's maximum size, or its core size for a
pool with no fixed maximum (scheduled/cached pools). Threshold unit is %; recommended threshold 85.
Queue length and rejected-task count are shown in the row detail.
Gateway Connection Pool Usage Percentage: Each HTTP connection pool of each pod, as leased
connections divided by max total × 100 — one row per pod and pool. Threshold unit is %;
recommended threshold 85. A pool with requests currently waiting for a connection is shown in the
row detail and marked Warning even when it is below the threshold; a pool with no max total
configured is listed as Warning.
Gateway GC Time Percentage: The share of time each pod's JVM has spent in garbage collection,
as total GC time divided by JVM uptime × 100. Both figures are cumulative since the JVM started, so
this is the lifetime GC share, not the last interval's. Threshold unit is %; recommended threshold
5.
Elasticsearch Trigger Types
Elasticsearch Health Status: Checks the health status of the Elasticsearch cluster (Green/Yellow/Red). Alarm is triggered when the cluster becomes unhealthy. Does not require threshold value. Requires connection definition. The evaluated row is labelled with the cluster's own name, as reported by the cluster itself, rather than a fixed "Elasticsearch cluster" label.
Elasticsearch CPU Percentage: Checks the CPU usage percentage of every node in the Elasticsearch cluster separately. Alarm is triggered when the CPU usage percentage of any node exceeds the threshold value; the alarm history and the Live check panel list one row per node, each labelled Elasticsearch node with the node's name, its measured percentage, and a state badge, so the offending node can be identified. Requires threshold value (e.g., 80 = 80%). Requires connection definition.
Elasticsearch Disk Percentage: Checks the disk usage percentage of every node in the Elasticsearch cluster separately. Alarm is triggered when the disk usage percentage of any node exceeds the threshold value; the alarm history and the Live check panel list one row per node, each labelled Elasticsearch node. Nodes that report no disk statistics (coordinating-only nodes) are skipped. Requires threshold value (e.g., 90 = 90%). Requires connection definition.
Elasticsearch Logs in Database: Checks whether Elasticsearch logs are in the database. Alarm is triggered when logs are in the database. Does not require threshold value.
When Elasticsearch cannot be checked: for all four Elasticsearch trigger types, if the connection cannot be evaluated the run's result is Error Occurred, its summary states that the check could not be checked, and the reason is one of three: the connection is not defined or is disabled, the cluster could not be reached, or the cluster returned no node statistics. The summary and reason text — like the rest of the trigger history and Live check rows — is shown in the interface's current language.
Certificate Trigger Types
SSL Certificate Remaining Duration: Checks the remaining duration of SSL certificates. Alarm is triggered when remaining duration is less than the threshold value. Requires threshold value (e.g., 30 = 30 days).
JWK Certificate Remaining Duration: Checks the remaining duration of JWK certificates. Alarm is triggered when remaining duration is less than the threshold value. Requires threshold value (e.g., 30 = 30 days).
Application Log Trigger Types
Application Log Count: Checks the count of a specific application log type. Alarm is triggered when log count exceeds the threshold value. Requires threshold value (e.g., 10000 = 10,000 records). Log type must be selected.
Supported Log Types:
- Manager Logs
- Gateway Logs
- Cache Logs
- Integration Logs
- Portal Logs
- Audit Logs Manager
- Audit Logs ACL
- And more...
Threshold Value
Threshold value determines when the alarm will be triggered. Different units are used according to the trigger type:
| Trigger Type | Unit | Example Value | Description |
|---|---|---|---|
| K8S Node CPU Percentage | % | 80 | When CPU usage exceeds 80% |
| Gateway Thread Count | Threads | 2000 | When the live thread count of any gateway worker pod exceeds 2000 |
| Gateway Heap Usage Percentage | % | 85 | When heap usage of any pod exceeds 85% |
| Gateway Deadlock Count | Deadlocks | 0 | When any pod has at least one deadlocked thread |
| Gateway Executor Pool Saturation Percentage | % | 85 | When active/capacity of any pool on any pod exceeds 85% |
| Gateway Connection Pool Usage Percentage | % | 85 | When leased/max total of any pool on any pod exceeds 85% |
| Gateway GC Time Percentage | % | 5 | When the lifetime GC share of any pod exceeds 5% |
| Elasticsearch CPU Percentage | % | 80 | When CPU usage exceeds 80% |
| Elasticsearch Disk Percentage | % | 90 | When disk usage exceeds 90% |
| SSL Certificate Remaining Duration | Days | 30 | When remaining duration is less than 30 days |
| JWK Certificate Remaining Duration | Days | 30 | When remaining duration is less than 30 days |
| Application Log Count | Records | 10000 | When log count exceeds 10,000 |
Threshold Value Recommendations:
- CPU Monitoring: Between 70-80%
- Disk Monitoring: Between 80-90%
- Certificate Tracking: Between 30-60 days
- Log Count: According to system capacity
Connection Definition
Some trigger types require Elasticsearch connection:
Trigger Types Requiring Connection:
- Elasticsearch Health Status
- Elasticsearch CPU Percentage
- Elasticsearch Disk Percentage
Trigger Types Not Requiring Connection:
- Kubernetes trigger types
- Gateway diagnostics trigger types — Gateway Thread Count, Gateway Heap Usage Percentage, Gateway Deadlock Count, Gateway Executor Pool Saturation Percentage, Gateway Connection Pool Usage Percentage, Gateway GC Time Percentage (each requires a Gateway Management API address on the environment instead)
- Certificate trigger types
- Application log trigger types
Elasticsearch connection is selected from connections created on the Connection Management page. Connection must be active and accessible.
Step 3: Scheduling Settings
Determine how frequently the alarm will be checked. Scheduling is done using Cron Expression.
Common Scheduling Examples
| Description | Cron Expression | Use Case |
|---|---|---|
| Every hour | 0 0 * ? * * | For general monitoring (most common) |
| Every 30 minutes | 0 */30 * ? * * | For critical systems |
| Every 15 minutes | 0 */15 * ? * * | For very critical systems |
| Every day at 09:00 | 0 0 9 * ? * | For daily reporting |
| Every 5 minutes | 0 */5 * ? * * | For situations requiring very frequent checks |
Recommendations:
- General Monitoring: Every hour
- Critical Systems: Every 15-30 minutes
- Certificate Tracking: Every day at 09:00
- Resource Monitoring: Every 30 minutes
Step 4: Notification Recipients
Configure recipients who will receive notifications when the alarm is triggered:
Adding Notifications
Click the "Add" button in the Actions table
Supported notification types:
- Email: Sends email notification
- Webhook: Sends HTTP POST request
- Slack: Sends message to Slack channel
- SMS: Sends SMS notification
- System Notification: Sends in-system notification
- And more...
Fill in the required information according to the notification type
For detailed information about actions, see the Connectors page.
Notification Management
Notification Table Columns:
- Name: Notification name
- Type: Notification type (Email, Webhook, Slack, etc.)
- Status: Active/Passive status
- Description: Notification description
Notification Operations:
- Edit: Select "Edit" from the menu to update notification information
- Delete: Select "Delete" from the menu to remove the notification
- Active/Passive: You can activate/deactivate the notification with toggle
Step 5: Saving
After filling in all information:
-
Make sure form validations pass:
- ✅ Name entered and available
- ✅ Trigger type selected
- ✅ Threshold value entered (if required)
- ✅ Connection definition selected (if required)
- ✅ Scheduling settings configured
-
Click the "Save" button
-
After the alarm is saved, you will be automatically redirected to the listing page
View and Results
Clicking the alarm name — or selecting "View" from the operations menu (⋮) — opens the alarm's single-page View screen. It shows both the latest evaluation results and the configuration in one place; there is no separate history page.
Header and Metric Cards
The top bar has Refresh, Activate/Deactivate, Back and Edit buttons. Below it are 5 summary metric cards:
- Current value: The value from the last evaluation (coloured by state)
- Threshold: The alarm's threshold value
- Last fired: Time of the most recent threshold breach
- Fires (24h): Number of times fired in the last 24 hours
- Actions: Number of attached notification channels
Tabs
Matched records
Every object evaluated on the last run (each Elasticsearch node, certificate, pod…), worst first. Each row shows the object name, value and a state badge:
- 🔴 BREACHED: Threshold exceeded
- 🟠 WARNING: Close to the threshold
- 🟢 NORMAL: Within safe limits
An "n of m breached" badge, an "Only breached" filter and pagination are provided.
Trigger history
The result of each evaluation — paginated table:
- Evaluated at: Evaluation date/time
- Value: The measured value. For Gateway Deadlock Count, the value is shown with its
deadlocksunit suffix (for example "2 deadlocks"); other trigger types show a bare number. - Result: 🟢 Threshold Not Exceeded · 🔴 Threshold Exceeded · 🟠 Error Occurred
- Summary: Check summary
- Detail: shown under the summary when present — the longer explanation (for example which pod/address could not be read, or how many objects breached)
Configuration
A read-only definition of the alarm:
- Alert definition: Name, description and Status: Enabled / Disabled badge
- Trigger: Trigger type + category badge, threshold, connection, log type, AI scope
- Schedule: Cron expression
- Actions: Notification channels (type, name, status)
Live Check Panel
The Live check panel on the right of the View screen runs the alarm's condition right now — without saving — and shows whether the alarm would fire:
- Evaluate now: Evaluates the condition immediately. This evaluation writes a Trigger history record and updates the current value in the list view; it does NOT fire notifications/recipients. The last evaluation time is shown below the button.
- Worst object: The value of the currently worst object with a threshold-marked bar.
- Objects evaluated: The evaluated objects and an "n of m breached" badge. For Elasticsearch CPU/Disk triggers each object is one cluster node, labelled Elasticsearch node; for the health trigger it is the cluster itself, labelled with its real cluster name.
- Last 12 evaluations: For triggers with a measured value, a line chart of recent evaluations with a red dashed threshold line. For status-only checks (for example Elasticsearch health, or any run that ended in an error) there is no single number to plot, so each of the last 12 runs is instead shown as a coloured status bar (breached/normal/error); hovering a bar shows that run's date and result.
- Result box: "Condition met — the alert would fire" (red), "Condition not met" (green), or an evaluation error (amber).
When the page opens the condition is evaluated automatically in read-only mode (no history is written); only the Evaluate now button writes a history record.
Alarm Management
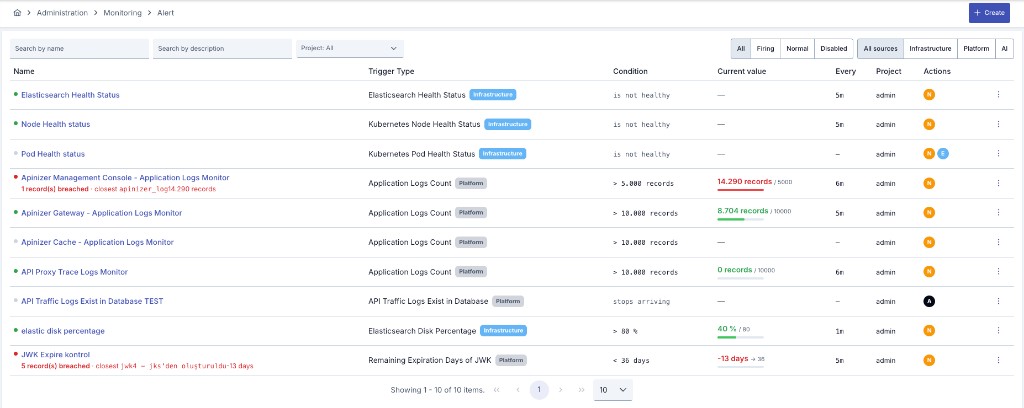
List Page Features
On the alarm list page, you can view and manage all your alarms.
Search and Filtering
- Name search: Filters by name (contains match)
- Description search: A separate search box that filters by description (contains match)
- Project Filter: Filter alarms by project (the admin list spans all projects)
- Status segment: All / Firing / Normal / Disabled
- Source segment: All sources / Infrastructure / Platform / AI — fed by the trigger type category
Table Columns
- Alert: Status dot + alarm name (clickable, goes to the View page) + description + breach summary ("N records breached · closest …")
- Trigger type: Trigger type + category badge (Infrastructure/Platform/AI)
- Condition: The condition (e.g.
≥ 85 %,is not healthy,stops arriving) - Current value: The value from the last evaluation (coloured) + threshold reference + bar
- Every: Check interval (e.g. 5m, 24h)
- Project: The alarm's project
- Actions: Notification channel chips
- ⋮: Operations menu
Operations Menu
For each alarm, click the menu button (⋮) to perform the following operations:
- View: Open the alarm's View page (metrics + Live check + history)
- Edit: Update alarm settings
- Activate / Deactivate: Enable or disable the alarm
- Duplicate: Create a copy of the alarm
- Delete: Delete the alarm
Changing Status (Activate/Deactivate)
To change the alarm's enabled/disabled status, select Activate or Deactivate from the
operations menu (⋮). The same action is also available in the top bar of the View screen. Only the
enabled flag changes; notification recipients and schedule are preserved. Disabled alarms do not
run, but their historical data is preserved.
Best Practices
- Use descriptive names:
Elasticsearch CPU Monitoring - Add environment/project prefix:
Production - SSL Certificate Tracking - Specify trigger type:
K8S Node CPU Monitoring
- CPU Monitoring: Between 70-80%
- Disk Monitoring: Between 80-90%
- Certificate Tracking: Between 30-60 days
- Log Count: According to system capacity
- Critical Systems: Every 15-30 minutes
- General Monitoring: Every hour
- Certificate Tracking: Every day at 09:00
- Resource Monitoring: Every 30 minutes
- Critical Alarms: Email + SMS notification
- General Alarms: Email notification is sufficient
- Webhook: Send notifications to your integration systems
- Notification Spam: Avoid notification spam with appropriate scheduling
Frequently Asked Questions
How Often Does Alarm Run?
The frequency of alarm execution depends on the Scheduling (Cron Expression) settings you determined when creating it. For example:
0 0 * ? * *→ Every hour0 */30 * ? * *→ Every 30 minutes0 0 9 * ? *→ Every day at 09:00
What Happens When Alarm is Deactivated?
When alarm is deactivated:
- No new checks are performed
- Existing scheduled jobs are cancelled
- History records are preserved and can be viewed
- Alarm continues normal operation when reactivated
How is Threshold Value Determined?
Threshold value should be determined according to your system's normal operating conditions:
- CPU Monitoring: 20-30% above normal CPU usage
- Disk Monitoring: 80-90% of disk capacity
- Certificate Tracking: Before certificate renewal time (e.g., 30 days)
- Log Count: According to system capacity
Can I Add Multiple Notifications?
Yes, you can add multiple notifications. Each notification:
- Can be a different type (Email, SMS, Webhook, etc.)
- Can be sent to different recipients
- Can be independently activated/deactivated
How Long Are History Records Kept?
History records are kept until manually deleted. To clean old records:
- You can use the "Delete All" button on the history page
- Or you can clean records regularly
What Happens When Alarm is Deleted?
When alarm is deleted:
- Alarm definition is deleted from database
- All history records are deleted
- Scheduled jobs are cancelled
- Historical data is permanently lost
Warning: Deletion cannot be undone!
Troubleshooting
Alarm Not Working
Possible Causes:
- Alarm may be in disabled status → Select Activate from the operations menu (verify from the Configuration tab of the View screen)
- Scheduling settings may be wrong → Check cron expression
- Elasticsearch connection may not exist or be inaccessible → Check connection settings
- Threshold value may be incorrectly configured → Check threshold value
Solution:
- Activate alarm status
- Check scheduling settings
- Check Elasticsearch connection
- Check threshold value
All Results Are in 'Error Occurred' Status
Possible Causes:
- Elasticsearch connection does not exist or is inaccessible
- Kubernetes cluster is inaccessible
- System resources are insufficient
- Configuration error
Solution:
- Check Elasticsearch connection
- Check Kubernetes cluster connection
- Check system resources
- Check alarm configuration
The Same Alarm Appears Twice in History With the Same Timestamp
Possible Cause:
- API Manager runs with more than one replica and the same check ran on two replicas at the same moment
Solution:
- Upgrade API Manager to the current version: with concurrently running replicas, each check now runs on one replica only
- Review the alarm history again after the next check interval to confirm a single row is produced
- If repeated rows persist, delete the alarm and create it again
Too Many Notifications Coming
Possible Causes:
- Threshold value is too low
- Scheduling is too frequent
- Multiple notifications are active
Solution:
- Increase threshold value
- Reduce scheduling frequency
- Deactivate unnecessary notifications
Notifications Not Coming
Possible Causes:
- Notification is in passive status
- Notification configuration is incorrect
- Email/SMS service is not working
Solution:
- Activate notification status
- Check notification configuration
- Check Email/SMS service settings